Simple feature collection with 20 features and 5 fields
Geometry type: POLYGON
Dimension:     XY
Bounding box:  xmin: -6381686 ymin: -6381694 xmax: 6381694 ymax: 6381694
Projected CRS: +proj=laea +lat_0=-90 +lon_0=0 +x_0=0 +y_0=0 +datum=WGS84 +units=m +no_defs
   name                       label        sector         zone    fill
1   AOA          Antarctic Atlantic      Atlantic    Antarctic #F9BDBC
2   AOS       Subantarctic Atlantic      Atlantic Subantarctic #F27071
3   AON           Northern Atlantic      Atlantic     Northern #E11F26
4   AOT          Temperate Atlantic      Atlantic         <NA>    <NA>
5   CIA    Antarctic Central Indian CentralIndian    Antarctic #F9D7C2
6   CIS Subantarctic Central Indian CentralIndian Subantarctic #F4B187
7   CIN     Northern Central Indian CentralIndian     Northern #EC8444
8   CIT    Temperate Central Indian CentralIndian         <NA>    <NA>
9   EIA       Antarctic East Indian    EastIndian    Antarctic #D1D3EA
10  EIS    Subantarctic East Indian    EastIndian Subantarctic #B0B4D9
11  EIN        Northern East Indian    EastIndian     Northern #878DC5
12  EIT       Temperate East Indian    EastIndian         <NA>    <NA>
13  WPA      Antarctic West Pacific   WestPacific    Antarctic #E0B8D6
14  WPS   Subantarctic West Pacific   WestPacific Subantarctic #C579B2
15  WPN       Northern West Pacific   WestPacific     Northern #843A75
16  WPT      Temperate West Pacific   WestPacific         <NA>    <NA>
17  EPA      Antarctic East Pacific   EastPacific    Antarctic #9FC5C7
18  EPS   Subantarctic East Pacific   EastPacific Subantarctic #609FA0
19  EPN       Northern East Pacific   EastPacific     Northern #4B7E7F
20  EPT      Temperate East Pacific   EastPacific         <NA>    <NA>
                         geometry
1  POLYGON ((-2891647 1737477,...
2  POLYGON ((1842392 3191116, ...
3  POLYGON ((2613013 4525871, ...
4  POLYGON ((-3353009 1723416,...
5  POLYGON ((279139.2 483483.3...
6  POLYGON ((1842392 3191116, ...
7  POLYGON ((2294977 3975017, ...
8  POLYGON ((2613013 4525871, ...
9  POLYGON ((3048452 -1421517,...
10 POLYGON ((533521.3 -3025749...
11 POLYGON ((4093993 -1909060,...
12 POLYGON ((4882884 -2276926,...
13 POLYGON ((524717.5 -3027289...
14 POLYGON ((9312.405 -2801188...
15 POLYGON ((637964.6 -3618077...
16 POLYGON ((16836.49 -4961088...
17 POLYGON ((-457314.9 -320215...
18 POLYGON ((-2250033 -1575490...
19 POLYGON ((-2992183 -2095149...
20 POLYGON ((-4421564 -3096013...
Version 05 is in the package as released (measo_regions05 etc., 24 rows with the West Pacific regions in two pieces, and measo_names row-aligned with them); see the README.
The files on the Data page (one row per region) are in the package too:
f <-system.file("extdata/measo_regions06.parquet", package ="measoshapes")
Reading from a URL
No package installation is needed to read the published files. GDAL reads them directly from the URL.
FlatGeobuf and GeoJSON work the same way (change the file name), and are a good choice if your GDAL doesn’t have the Parquet driver (check "Parquet" %in% sf::st_drivers()$name).
Assigning regions to data
To find the region for longitude/latitude locations, transform them to the polar equal area projection and join with the polar regions:
     lon   lat name                    label        sector      zone    fill
1  147.3 -50.2  EIN     Northern East Indian    EastIndian  Northern #878DC5
2  100.5 -60.5  CIA Antarctic Central Indian CentralIndian Antarctic #F9D7C2
3  -10.5 -70.5  AOA       Antarctic Atlantic      Atlantic Antarctic #F9BDBC
4  -82.5 -45.5  EPN    Northern East Pacific   EastPacific  Northern #4B7E7F
5  171.5 -65.5  WPA   Antarctic West Pacific   WestPacific Antarctic #E0B8D6
6 -175.5 -65.5  WPA   Antarctic West Pacific   WestPacific Antarctic #E0B8D6
The polar regions are densified to 0.2° from the longitude/latitude definition, so this agrees with the definition except for locations within a very short distance of a boundary.
For gridded data, the same applies: classify cell centres, or rasterize the polar regions onto your grid (e.g. terra::rasterize(terra::vect(regions), grid, field = "name")).
Maps
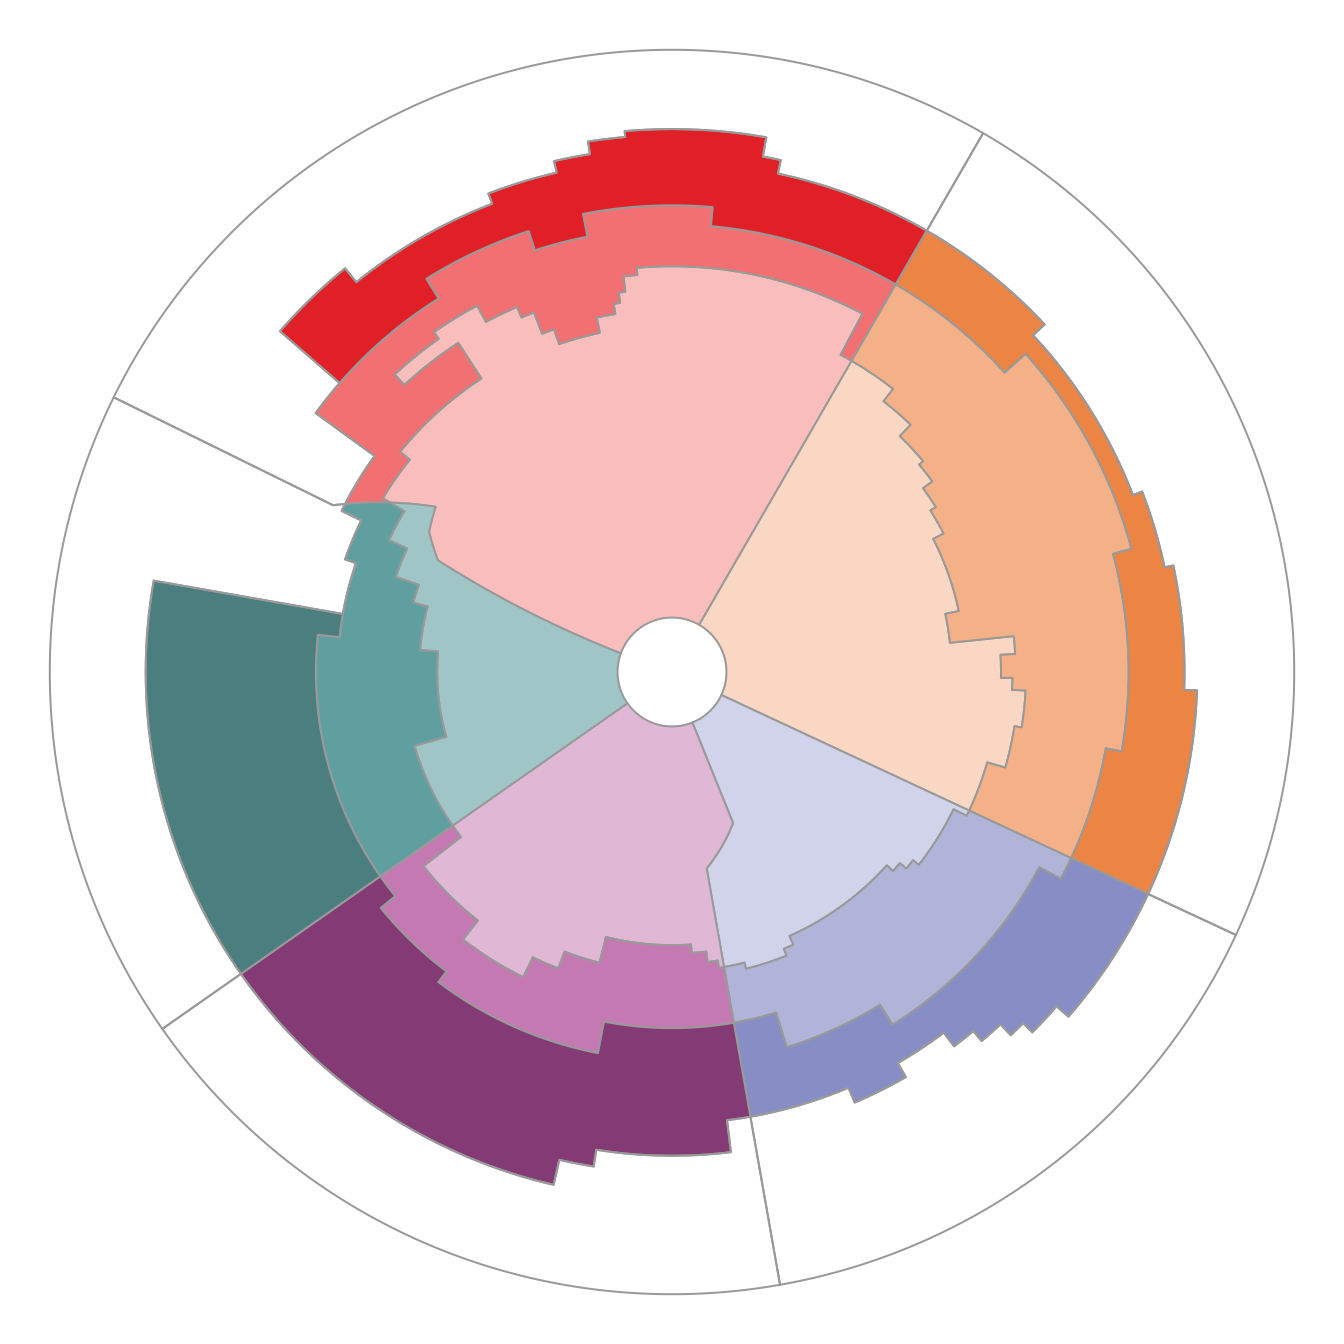
par(mar =rep(0, 4))plot(st_geometry(regions), col = regions$fill, border ="grey60")
Figure 1: Base graphics with the fill colours.
With ggplot2, use the colours as they are with scale_fill_identity():