Blueant provides a set of data source configurations to use with the bowerbird package. These data sources are themed around Antarctic and Southern Ocean data, and include a range of oceanographic, meteorological, topographic, and other environmental data sets. Blueant will allow you to download data from these external data providers to your local file system, and to keep that data collection up to date.
Installing
## Download and install blueant in R
install.packages("blueant", repos = c(SCAR = "https://scar.r-universe.dev",
                                      CRAN = "https://cloud.r-project.org"))

## or
## install.packages("remotes") ## if needed
remotes::install_github("AustralianAntarcticDivision/blueant")
Usage overview
Configuration
Build up a configuration by first defining global options such as the destination on your local file system. Usually you would choose this destination data directory to be a persistent location, suitable for a data library. For demonstration purposes here we’ll just use a temporary directory:
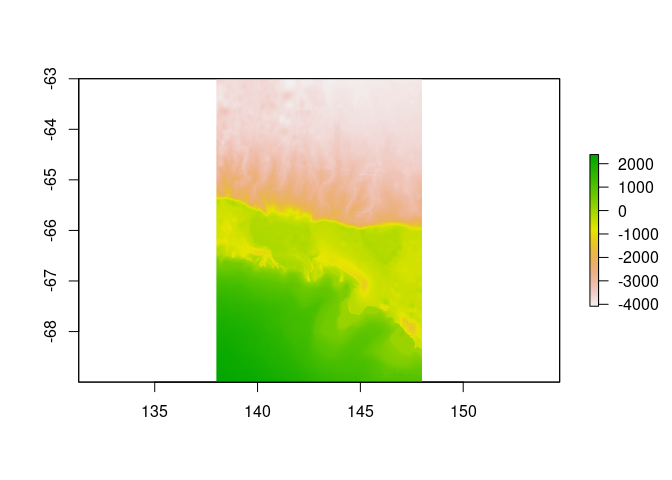
Add data sources from those provided by blueant. A summary of these sources is given at the end of this document. Here we’ll use the “George V bathymetry” data source as an example:
This data source is fairly small (around 200MB, see mysrc$collection_size). Be sure to check the collection_size parameter of your chosen data source before running the synchronization. Some of these collections are quite large (see the summary table at the bottom of this document).
Synchronization
Once the configuration has been defined and the data source added to it, we can run the sync process. We set verbose = TRUE here so that we see additional progress output:
status <- bb_sync(cf, verbose = TRUE)##
## Fri Feb 2 12:41:52 2024
## Synchronizing dataset: George V bathymetry
## --------------------------------------------------------------------------------------------
##
## this dataset path is: /tmp/data/data.aad.gov.au/eds/api/dataset/B6337379-D42F-4340-BCFB-1A154D7C3FF1/GVdem_2008
## downloading file 1 of 5: https://data.aad.gov.au/eds/api/dataset/B6337379-D42F-4340-BCFB-1A154D7C3FF1/object/download?prefix=GVdem_2008_netcdf/README ... file unchanged on server, not downloading.
## downloading file 2 of 5: https://data.aad.gov.au/eds/api/dataset/B6337379-D42F-4340-BCFB-1A154D7C3FF1/object/download?prefix=GVdem_2008_netcdf/gvdem1000m_v3.nc ... file unchanged on server, not downloading.
## downloading file 3 of 5: https://data.aad.gov.au/eds/api/dataset/B6337379-D42F-4340-BCFB-1A154D7C3FF1/object/download?prefix=GVdem_2008_netcdf/gvdem100m_v3.nc ... done.
## downloading file 4 of 5: https://data.aad.gov.au/eds/api/dataset/B6337379-D42F-4340-BCFB-1A154D7C3FF1/object/download?prefix=GVdem_2008_netcdf/gvdem250m_v3.nc ... done.
## downloading file 5 of 5: https://data.aad.gov.au/eds/api/dataset/B6337379-D42F-4340-BCFB-1A154D7C3FF1/object/download?prefix=GVdem_2008_netcdf/gvdem500m_v3.nc ... done.
##
## Fri Feb 2 12:42:36 2024 dataset synchronization complete: George V bathymetryCongratulations! You now have your own local copy of this data set. The files in this data set have been stored in a data-source-specific subdirectory of our local file root, with details given by the returned status object:
myfiles <- status$files[[1]]
myfiles
## # A tibble: 5 × 3
##   url
##   <chr>
## 1 https://data.aad.gov.au/eds/api/dataset/B6337379-D42F-4340-BCFB-1A154D7C3FF1/…
## 2 https://data.aad.gov.au/eds/api/dataset/B6337379-D42F-4340-BCFB-1A154D7C3FF1/…
## 3 https://data.aad.gov.au/eds/api/dataset/B6337379-D42F-4340-BCFB-1A154D7C3FF1/…
## 4 https://data.aad.gov.au/eds/api/dataset/B6337379-D42F-4340-BCFB-1A154D7C3FF1/…
## 5 https://data.aad.gov.au/eds/api/dataset/B6337379-D42F-4340-BCFB-1A154D7C3FF1/…
##   file
##   <chr>
## 1 /tmp/data/data.aad.gov.au/eds/api/dataset/B6337379-D42F-4340-BCFB-1A154D7C3FF…
## 2 /tmp/data/data.aad.gov.au/eds/api/dataset/B6337379-D42F-4340-BCFB-1A154D7C3FF…
## 3 /tmp/data/data.aad.gov.au/eds/api/dataset/B6337379-D42F-4340-BCFB-1A154D7C3FF…
## 4 /tmp/data/data.aad.gov.au/eds/api/dataset/B6337379-D42F-4340-BCFB-1A154D7C3FF…
## 5 /tmp/data/data.aad.gov.au/eds/api/dataset/B6337379-D42F-4340-BCFB-1A154D7C3FF…
##   note
##   <chr>
## 1 existing copy
## 2 existing copy
## 3 downloaded
## 4 downloaded
## 5 downloaded
The data sources provided by blueant can be read, manipulated, and plotted using a range of other R packages, including RAADTools and raster. In this case the data files are netcdf, which can be read by raster:
Nuances
Choosing a data directory
It’s up to you where you want your data collection kept, and to provide that location to bowerbird. A common use case for bowerbird is maintaining a central data collection for multiple users, in which case that location is likely to be some sort of networked file share. However, if you are keeping a collection for your own use, you might like to look at https://github.com/r-lib/rappdirs to help find a suitable directory location.
Authentication
Some data providers require users to log in. These are indicated by the authentication_note column in the configuration table. For these sources, you will need to provide your user name and password, e.g.:
src <- sources(name="CMEMS global gridded SSH reprocessed (1993-ongoing)")
src$user <- "yourusername"
src$password <- "yourpassword"
cf <- bb_add(cf, src)

## or, using the pipe operator
mysrc <- bb_example_sources("CMEMS global gridded SSH reprocessed (1993-ongoing)") %>%
  bb_modify_source(user = "yourusername", password = "yourpassword")
cf <- cf %>% bb_add(mysrc)
Writing and modifying data sources
The bowerbird documentation is a good place to start to find out more about writing your own data sources or modifying existing ones.
Reducing download sizes
Sometimes you might only want part of a data collection. Perhaps you only want a few years from a long-term collection, or perhaps the data are provided in multiple formats and you only need one. If the data source uses the bb_handler_rget method, you can restrict what is downloaded by modifying the arguments passed through the data source’s method parameter, particularly the accept_follow, reject_follow, accept_download, and reject_download options.
For example, the CERSAT SSM/I sea ice concentration data are arranged in yearly directories, and so it is fairly easy to restrict ourselves to, say, only the 2017 data:
mysrc <- sources("CERSAT SSM/I sea ice concentration")

## first make sure that the data source doesn't already have an accept_follow parameter defined
"accept_follow" %in% names(mysrc$method[[1]])

## nope, so we can safely go ahead and impose our own
mysrc$method[[1]]$accept_follow <- "/2017"
cf <- cf %>% bb_add(mysrc)
Alternatively, for data sources that are divided into subdirectories, one could replace the whole-data-source source_url with one or more that point to specific yearly (or other) subdirectories. For example, the default source_url for the CERSAT sea ice data above is ftp://ftp.ifremer.fr/ifremer/cersat/products/gridded/psi-concentration/data/antarctic/daily/netcdf/ (which has yearly subdirectories). So e.g. for 2016 and 2017 data we could do:
mysrc <- sources("CERSAT SSM/I sea ice concentration")
mysrc$source_url[[1]] <- c(
  "ftp://ftp.ifremer.fr/ifremer/cersat/products/gridded/psi-concentration/data/antarctic/daily/netcdf/2016/",
  "ftp://ftp.ifremer.fr/ifremer/cersat/products/gridded/psi-concentration/data/antarctic/daily/netcdf/2017/")
cf <- cf %>% bb_add(mysrc)Data source summary
These are the data source definitions that are provided as part of the blueant package.
Data group: Altimetry
CMEMS global gridded SSH near-real-time
Altimeter satellite gridded Sea Level Anomalies (SLA) computed with respect to a twenty-year [1993, 2012] mean. The SLA is estimated by Optimal Interpolation, merging the L3 along-track measurement from the different altimeter missions available. Part of the processing is fitted to the Global ocean. (see QUID document or http://duacs.cls.fr pages for processing details). The product gives additional variables (i.e. Absolute Dynamic Topography and geostrophic currents (absolute and anomalies)). It serves in delayed-time applications. This product is processed by the DUACS multimission altimeter data processing system.
Authentication note: Copernicus Marine login required, see http://marine.copernicus.eu/services-portfolio/register-now/
Approximate size: 3 GB
Documentation link: https://data.marine.copernicus.eu/product/SEALEVEL_GLO_PHY_L4_NRT_008_046/description
CMEMS global gridded SSH reprocessed (1993-ongoing)
For the Global Ocean - Multimission altimeter satellite gridded sea surface heights and derived variables computed with respect to a twenty-year mean. Previously distributed by Aviso+, no change in the scientific content. All the missions are homogenized with respect to a reference mission which is currently OSTM/Jason-2. VARIABLES
sea_surface_height_above_sea_level (SSH)
surface_geostrophic_eastward_sea_water_velocity_assuming_sea_level_for_geoid (UVG)
surface_geostrophic_northward_sea_water_velocity_assuming_sea_level_for_geoid (UVG)
sea_surface_height_above_geoid (SSH)
surface_geostrophic_eastward_sea_water_velocity (UVG)
surface_geostrophic_northward_sea_water_velocity (UVG)
Authentication note: Copernicus Marine login required, see http://marine.copernicus.eu/services-portfolio/register-now/
Approximate size: 310 GB
Documentation link: https://data.marine.copernicus.eu/product/SEALEVEL_GLO_PHY_L4_MY_008_047/description
Delayed-time finite size Lyapunov exponents
The maps of Backward-in-time, Finite-Size Lyapunov Exponents (FSLEs) and Orientations of associated eigenvectors are computed over 21-year altimetry period and over global ocean within the SALP/Cnes project in collaboration with CLS, LOcean and CTOH. These products provide the exponential rate of separation of particle trajectories initialized nearby and advected by altimetry velocities. FSLEs highlight the transport barriers that control the horizontal exchange of water in and out of eddy cores.
Authentication note: AVISO login required, see https://www.aviso.altimetry.fr/en/data/data-access/endatadata-accessregistration-form.html
Approximate size: 1200 GB
Documentation link: https://www.aviso.altimetry.fr/en/data/products/value-added-products/fsle-finite-size-lyapunov-exponents/fsle-description.html
Global Ocean Mean Dynamic Topography
Mean Dynamic Topography that combines the global CNES-CLS-2022 MDT, the Black Sea CMEMS2020 MDT and the Med Sea CMEMS2020 MDT. It is an estimate of the mean over the 1993-2012 period of the sea surface height above geoid. This is consistent with the reference time period also used in the DUACS products.
Authentication note: Copernicus Marine login required, see http://marine.copernicus.eu/services-portfolio/register-now/
Approximate size: 0.1 GB
Documentation link: https://data.marine.copernicus.eu/product/SEALEVEL_GLO_PHY_MDT_008_063/description
Gridded Sea Level Heights and geostrophic currents - Antarctic Ocean
Experimental Ssalto/Duacs gridded multimission altimeter products dedicated to Antarctic Ocean. This dataset is one of the experimental products which are available on the SSALTO/DUACS experimental products. Multimission sea level heights computed with respect to a twenty-year mean and associated geostrophic current anomalies. The formal error is also included.
Authentication note: AVISO login required, see https://www.aviso.altimetry.fr/en/data/data-access/endatadata-accessregistration-form.html
Approximate size: 4.5 GB
Documentation link: https://www.aviso.altimetry.fr/en/data/products/sea-surface-height-products/regional/antarctic-sea-level-heights.html
Near-real-time finite size Lyapunov exponents
The maps of Backward-in-time, Finite-Size Lyapunov Exponents (FSLEs) and Orientations of associated eigenvectors are computed over 21-year altimetry period and over global ocean within the SALP/Cnes project in collaboration with CLS, LOcean and CTOH. These products provide the exponential rate of separation of particle trajectories initialized nearby and advected by altimetry velocities. FSLEs highlight the transport barriers that control the horizontal exchange of water in and out of eddy cores.
Authentication note: AVISO login required, see https://www.aviso.altimetry.fr/en/data/data-access/endatadata-accessregistration-form.html
Approximate size: 100 GB
Documentation link: https://www.aviso.altimetry.fr/en/data/products/value-added-products/fsle-finite-size-lyapunov-exponents/fsle-description.html
WAVERYS Global Ocean Waves Reanalysis
Global wave reanalysis describing past sea states since years 1993. This product also bears the name of WAVERYS within the GLO-HR MFC. for correspondence to other global multi-year products like GLORYS. BIORYS. etc. The core of WAVERYS is based on the MFWAM model. a third generation wave model that calculates the wave spectrum. i.e. the distribution of sea state energy in frequency and direction on a 1/5 degree irregular grid. Average wave quantities derived from this wave spectrum. such as the SWH (significant wave height) or the average wave period. are delivered on a regular 1/5 degree grid with a 3h time step. The wave spectrum is discretized into 30 frequencies obtained from a geometric sequence of first member 0.035 Hz and a reason 7.5. WAVERYS takes into account oceanic currents from the GLORYS12 physical ocean reanalysis and assimilates significant wave height observed from historical altimetry missions and directional wave spectra from Sentinel 1 SAR from 2017 onwards.
Authentication note: Copernicus Marine login required, see http://marine.copernicus.eu/services-portfolio/register-now/
Approximate size: 1100 GB
Documentation link: https://data.marine.copernicus.eu/product/GLOBAL_MULTIYEAR_WAV_001_032/description
Data group: Biology
Myctobase
The global importance of mesopelagic fish is increasingly recognised, but they remain poorly studied. This is particularly true in the Southern Ocean, where mesopelagic fishes are both key predators and prey, but where the remote environment makes sampling them challenging. Despite this, multiple national Antarctic research programs have undertaken regional sampling of mesopelagic fish over several decades. However, data are dispersed, and sampling methodologies often differ precluding comparisons and limiting synthetic analyses. Here, we have collated and standardised existing survey data of mesopelagic fishes into a circumpolar dataset called Myctobase. To date, Myctobase holds 17,491 occurrence and 11,190 abundance records from 4780 net hauls from 72 different research cruises. Data include trait-based information of individuals including standard length, weight and life-stage. Data span across 37 years from 1991 to 2019. Detailed metadata has also been provided for each sampling event including the date, time, position (latitude, longitude, and depth), sampling protocol, net type, net mesh size, tow speed, volume filtered and haul type (routine, target, random).
The dataset is comprised of three comma-separated files. The first file (event.csv) describes the survey methodology. The second file (groupOccurrence.csv) contains the catch data linked to the survey methodology by an event ID. The final file (individualOccurrence.csv) contains measurements of individuals. Each row contains the event and occurrence ID, which links each measurement to the first and second file. See associated metadata record for definitions and units for each variable in ‘definitions.xlsx’.
The final dataset was subject to quality control and validation processes. Entries with ambiguous or incomplete records were identified with a ‘0’ in the column labelled ‘validation’ (event.csv) and a description of the missing data can be found in the proceeding column labelled ‘validationDescription’.
The taxonomic name for each individual was verified against the World Register of Marine Species (http://www.marinespecies.org/).
Approximate size: 0 GB
Documentation link: https://doi.org/10.5281/zenodo.6809070
SCAR RAATD data filtered
The Retrospective Analysis of Antarctic Tracking Data (RAATD) is a Scientific Committee for Antarctic Research (SCAR) project led jointly by the Expert Groups on Birds and Marine Mammals and Antarctic Biodiversity Informatics, and endorsed by the Commission for the Conservation of Antarctic Marine Living Resources. The RAATD project team consolidated tracking data for multiple species of Antarctic meso- and top-predators to identify Areas of Ecological Significance. These datasets constitute the compiled tracking data from a large number of research groups that have worked in the Antarctic since the 1990s.
This metadata record pertains to the “filtered” version of the data files. These files contain position estimates that have been processed using a state-space model in order to estimate locations at regular time intervals. For technical details of the filtering process, consult the data paper. The filtering code can be found in the https://github.com/SCAR/RAATD repository.
This data set comprises one metadata csv file that describes all deployments, along with data files (3 files for each of 17 species). For each species there is:
an RDS file that contains the fitted filter model object and model predictions (this file is RDS format that can be read by the R statistical software package)
a PDF file that shows the quality control results for each individual model
a CSV file containing the interpolated position estimates
For details of the file contents and formats, consult the data paper.
The data are also available in a standardized version (see https://data.aad.gov.au/metadata/records/SCAR_EGBAMM_RAATD_2018_Standardised) that contain position estimates as provided by the original data collectors (generally, raw Argos or GPS locations, or estimated GLS locations) without state-space filtering.
Approximate size: 1.6 GB
Documentation link: https://doi.org/10.4225/15/5afcadad6c130
SCAR RAATD data standardised
The Retrospective Analysis of Antarctic Tracking Data (RAATD) is a Scientific Committee for Antarctic Research (SCAR) project led jointly by the Expert Groups on Birds and Marine Mammals and Antarctic Biodiversity Informatics, and endorsed by the Commission for the Conservation of Antarctic Marine Living Resources. The RAATD project team consolidated tracking data for multiple species of Antarctic meso- and top-predators to identify Areas of Ecological Significance. These datasets constitute the compiled tracking data from a large number of research groups that have worked in the Antarctic since the 1990s.
This metadata record pertains to the “standardized” version of the data files. These files contain position estimates as provided by the original data collectors (generally, raw Argos or GPS locations, or estimated GLS locations). Original data files have been converted to a common format and quality-checking applied, but have not been further filtered or interpolated.
Periods at the start or end of deployments were identified and discarded if there was evidence that location data during these periods did not represent the animals’ at-sea movement. For example, tags may have been turned on early (thereby recording locations prior to their deployment on animals) or animals may have remained at the deployment site, e.g. the breeding colony, for an extended period at the start or end of the tag deployment. Some tracks also showed a marked deterioration in the frequency and quality (for PTTs) of location estimates near the end of a track. Such locations were visually identified based on maps of each track in conjunction with plots of location distance from deployment site against time. This information is captured in the location_to_keep column appended to each species’ data file (1 = keep, 0 = discard). The code used to trim the tracks can be found in the https://github.com/SCAR/RAATD repository.
This data set comprises one metadata csv file that describes all deployments, along with data csv files (17 files, one per species) containing the position data. For details of the file formats, consult the data paper.
The data are also available in a filtered version (see https://data.aad.gov.au/metadata/records/SCAR_EGBAMM_RAATD_2018) that have been processed using a state-space model in order to estimate locations at regular time intervals.
Approximate size: 0.3 GB
Documentation link: https://doi.org/10.1038/s41597-020-0406-x
SCAR RAATD model outputs
We assembled tracking data from seabirds (n = 12 species) and marine mammals (n = 5 species), collected between 1991 and 2016, from across the Antarctic predator research community. See https://data.aad.gov.au/metadata/records/SCAR_EGBAMM_RAATD_2018_Standardised and https://data.aad.gov.au/metadata/records/SCAR_EGBAMM_RAATD_2018_Filtered for the tracking data. Habitat selectivity modelling was applied to these tracking data in order to identify the environmental characteristics important to each species, and to produce circum-Antarctic predictions of important geographic space for each individual species. The individual species maps were then combined to identify regions important to our full suite of species. This approach enabled us to account for incomplete tracking coverage (i.e., colonies from which no animals have been tracked) and to produce an integrated and spatially explicit assessment of areas of ecological importance across the Southern Ocean.
The data attached to this metadata record include the single-species maps for Adelie, emperor, king, macaroni, and royal penguins; Antarctic and white-chinned petrels; black-browed, grey-headed, light-mantled, sooty, and wandering albatross; humpback whales; Antarctic fur seal, southern elephant seals, and crabeater and Weddell seals. The data also include the integrated maps that incorporate all species (weighted by colony size, and unweighted). See the paper and its supplementary information for full details on the modelling process and discussion of the model outputs.
Approximate size: 0.1 GB
Documentation link: https://doi.org/10.1038/s41586-020-2126-y
SEAPODYM Zooplankton & Micronekton weekly potential and biomass distribution
The zooplankton & micronekton biomass distributions are outputs of the SEAPODYM Low and Mid-Trophic Levels (LMTL) model (Lehodey et al., 1998; 2010; 2015). SEAPODYM-LMTL model simulates the spatial and temporal dynamics of six micronekton and one zooplankton functional groups between the sea surface and ~1000m. The model is driven by ocean temperature, horizontal currents, primary production and euphotic depth. Primary production can be outputs from biogeochemical models or derived from ocean color satellite data using empirical optical models (e.g., Behrenfeld and Falkowski 1997).
Authentication note: Requires registration, see http://www.mesopp.eu/data/registration/
Approximate size: not specified
Documentation link: http://www.mesopp.eu/catalogue/seapodym-zooplankton-micronekton-weekly-potential-and-biomass-distribution-2016/#dataset
Southern Ocean Continuous Plankton Recorder
This dataset contains results from Continuous Plankton Recorder (CPR) surveys in the Southern Ocean. When the opportunity arises, zooplankton species, numbers and abundance data are recorded on a continuous basis as vessels steam through the area between Australia and Antarctica, including Heard and Macquarie Islands. Observations have been made since June 1990 and are ongoing. Obviously the observations are not continuous over the region with time.
Many of the original SO-CPR logbooks from the various voyages have also been scanned, and are available via the Australian Antarctic Data Centre’s Reports Register.
Zooplankton have been identified to lowest possible taxon, usually species, and counted for each segment. For copepods, copepodites and for some species nauplii (e.g. Rhincalanus gigas) have been counted separately, and for euphausiids, naupliar, calyptopis and furcilia developmental stages are identified.
The fields in this dataset are: Tow_number - the CPR tow number Ship_name - the name of the ship on which the tow was conducted Season - two-year Antarctic season based around the austral summer, e.g. ‘2000-01’ runs from July 2000 to June 2001 Latitude - the decimal latitude of the segment sample Longitude - the decimal longitude of the segment sample Observation_date - UTC date and time of the segment sample in ISO8601 format (yyyy-mm-ddTHH:MMZ) Observation_date_year - the observation date year Observation_date_month - the observation date month Observation_date_day - the observation date day Observation_date_hour - the observation date hour Observation_date_minute - the observation date minute Observation_date_time_zone - the observation date time zone (0=UTC) Segment_number - the individual segment number within each tow Segment_length - the distance travelled by the CPR during this segment (nautical miles). This is the true segment length as used in the Geocoding program used to cut the silk, and to calculate positions and average environmental data for each segment. In theory, all segments are 5 nautical miles long. However, this wasn’t always the case with early Aurora Australis tows, where it was assumed that each marked segment was 5 nautical miles whereas each tow had subtle variations in silk advancement, depending on the wear of the cassette or travel with or against a current. True segment length has since been recalculated. At other times, some silks have been incorrectly cut and the true length has again been recalculated. The last segment of each tow may be less than 5 nautical miles. This field can be used to standardise species counts to say 5 nautical miles or to a theoretical volume filtered by multiplying the distance travelled by aperture area (12.7 x 12.7 mm): Volume Filtered = Distance (n miles) x 1852 metres x 0.0127^2. A 5 nautical mile segment theoretically represents 1.49 m^3.
Total_abundance - total count of all zooplankton in a segment
Phytoplankton_colour_index - visual estimation of the green colour of the silk mesh. Values are ‘No Colour’, ‘Very Pale Green’, ‘Pale Green’, or ‘Green’. This colouration is due to the green chlorophyll pigments derived from chloroplasts of intact and broken cells and small unarmoured flagellates. It may provide an indicator of phytoplankton standing stock, although in the Southern Ocean there are some diatoms that are quite common on the silks but as they have very low amounts of chlorophyll the colour doesn’t register in the PCI analysis.
Fluorescence - water fluoresence measured by the vessel, averaged for the segment (arbitrary units). See Quality notes for more information.
Salinity - water salinity measured by the vessel, averaged for the segment (psu). See Quality notes for more information.
Water_temperature - water temperature measured by the vessel (degrees Celsius). See Quality notes for more information.
Photosynthetically_active_radiation - photosynthetically active radiation measured by the vessel (micro-Einsteins m-2 s-1). This is not available on some vessels but has been included as a useful parameter to help differentiate data from night and day.
The remaining fields (‘Abylidae’ through to ‘Vibilia_sp’) are zooplankton taxon names. The entries in these columns are the counts of each taxon in the segment.
Approximate size: 0.1 GB
Documentation link: https://doi.org/10.26179/vthe-7b65
Data group: Meteorological
Antarctic Mesoscale Prediction System grib files
The Antarctic Mesoscale Prediction System - AMPS - is an experimental, real-time numerical weather prediction capability that provides support for the United States Antarctic Program, Antarctic science, and international Antarctic efforts.
Approximate size: not specified
Documentation link: http://www2.mmm.ucar.edu/rt/amps/
Data group: Modelling
Southern Ocean marine environmental data
This dataset is a collection of marine environmental data layers suitable for use in Southern Ocean species distribution modelling. All environmental layers have been generated at a spatial resolution of 0.1 degrees, covering the Southern Ocean extent (80 degrees S - 45 degrees S, -180 - 180 degrees). The layers include information relating to bathymetry, sea ice, ocean currents, primary production, particulate organic carbon, and other oceanographic data.
An example of reading and using these data layers in R can be found at https://australianantarcticdivision.github.io/blueant/articles/SO_SDM_data.html.
The following layers are provided:
- Layer name: depth Description: Bathymetry. Downloaded from GEBCO 2014 (0.0083 degrees = 30sec arcmin resolution) and set at resolution 0.1 degrees. Then completed with the bathymetry layer manually corrected and provided in Fabri-Ruiz et al. (2017) Value range: -8038.722 - 0 Units: m
Source: This study. Derived from GEBCO URL: https://www.gebco.net/data_and_products/gridded_bathymetry_data/ Citation: Fabri-Ruiz S, Saucede T, Danis B and David B (2017). Southern Ocean Echinoids database_An updated version of Antarctic, Sub-Antarctic and cold temperate echinoid database. ZooKeys, (697), 1.
Layer name: geomorphology Description: Last update on biodiversity.aq portal. Derived from O’Brien et al. (2009) seafloor geomorphic feature dataset. Mapping based on GEBCO contours, ETOPO2, seismic lines). 27 categories Value range: 27 categories Units: categorical Source: This study. Derived from Australian Antarctic Data Centre URL: https://data.aad.gov.au/metadata/records/Polar_Environmental_Data Citation: O’Brien, P.E., Post, A.L., and Romeyn, R. (2009) Antarctic-wide geomorphology as an aid to habitat mapping and locating vulnerable marine ecosystems. CCAMLR VME Workshop 2009. Document WS-VME-09/10
Layer name: sediments Description: Sediment features Value range: 14 categories Units: categorical Source: Griffiths 2014 (unpublished) URL: http://share.biodiversity.aq/GIS/antarctic/
Layer name: slope Description: Seafloor slope derived from bathymetry with the terrain function of raster R package. Computation according to Horn (1981), ie option neighbor=8. The computation was done on the GEBCO bathymetry layer (0.0083 degrees resolution) and the resolution was then changed to 0.1 degrees. Unit set at degrees. Value range: 0.000252378 - 16.94809 Units: degrees Source: This study. Derived from GEBCO URL: https://www.gebco.net/data_and_products/gridded_bathymetry_data/ Citation: Horn, B.K.P., 1981. Hill shading and the reflectance map. Proceedings of the IEEE 69:14-47
Layer name: roughness Description: Seafloor roughness derived from bathymetry with the terrain function of raster R package. Roughness is the difference between the maximum and the minimum value of a cell and its 8 surrounding cells. The computation was done on the GEBCO bathymetry layer (0.0083 degrees resolution) and the resolution was then changed to 0.1 degrees. Value range: 0 - 5171.278 Units: unitless Source: This study. Derived from GEBCO URL: https://www.gebco.net/data_and_products/gridded_bathymetry_data/
Layer name: mixed layer depth Description: Summer mixed layer depth climatology from ARGOS data. Regridded from 2-degree grid using nearest neighbour interpolation Value range: 13.79615 - 461.5424 Units: m Source: https://data.aad.gov.au/metadata/records/Polar_Environmental_Data
Layer name: seasurface_current_speed Description: Current speed near the surface (2.5m depth), derived from the CAISOM model (Galton-Fenzi et al. 2012, based on ROMS model) Value range: 1.50E-04 - 1.7 Units: m/s Source: This study. Derived from Australian Antarctic Data Centre URL: https://data.aad.gov.au/metadata/records/Polar_Environmental_Data Citation: see Galton-Fenzi BK, Hunter JR, Coleman R, Marsland SJ, Warner RC (2012) Modeling the basal melting and marine ice accretion of the Amery Ice Shelf. Journal of Geophysical Research: Oceans, 117, C09031. http://dx.doi.org/10.1029/2012jc008214, https://data.aad.gov.au/metadata/records/polar_environmental_data
Layer name: seafloor_current_speed Description: Current speed near the sea floor, derived from the CAISOM model (Galton-Fenzi et al. 2012, based on ROMS) Value range: 3.40E-04 - 0.53 Units: m/s Source: This study. Derived from Australian Antarctic Data Centre URL: https://data.aad.gov.au/metadata/records/Polar_Environmental_Data Citation: see Galton-Fenzi BK, Hunter JR, Coleman R, Marsland SJ, Warner RC (2012) Modeling the basal melting and marine ice accretion of the Amery Ice Shelf. Journal of Geophysical Research: Oceans, 117, C09031. http://dx.doi.org/10.1029/2012jc008214, https://data.aad.gov.au/metadata/records/polar_environmental_data
Layer name: distance_antarctica Description: Distance to the nearest part of the Antarctic continent Value range: 0 - 3445 Units: km Source: https://data.aad.gov.au/metadata/records/Polar_Environmental_Data
Layer name: distance_canyon Description: Distance to the axis of the nearest canyon Value range: 0 - 3117 Units: km Source: https://data.aad.gov.au/metadata/records/Polar_Environmental_Data
Layer name: distance_max_ice_edge Description: Distance to the mean maximum winter sea ice extent (derived from daily estimates of sea ice concentration) Value range: -2614.008 - 2314.433 Units: km Source: https://data.aad.gov.au/metadata/records/Polar_Environmental_Data
Layer name: distance_shelf Description: Distance to nearest area of seafloor of depth 500m or shallower Value range: -1296 - 1750 Units: km Source: https://data.aad.gov.au/metadata/records/Polar_Environmental_Data
Layer name: ice_cover_max Description: Ice concentration fraction, maximum on [1957-2017] time period Value range: 0 - 1 Units: unitless Source: BioOracle accessed 24/04/2018, see Assis et al. (2018) URL: http://www.bio-oracle.org/ Citation: Assis J, Tyberghein L, Bosch S, Verbruggen H, Serrao EA and De Clerck O (2018). Bio_ORACLE v2. 0: Extending marine data layers for bioclimatic modelling. Global Ecology and Biogeography, 27(3), 277-284 , see also https://www.ecmwf.int/en/research/climate-reanalysis/ocean-reanalysis
Layer name: ice_cover_mean Description: Ice concentration fraction, mean on [1957-2017] time period Value range: 0 - 0.9708595 Units: unitless Source: BioOracle accessed 24/04/2018, see Assis et al. (2018) URL: http://www.bio-oracle.org/ Citation: Assis J, Tyberghein L, Bosch S, Verbruggen H, Serrao EA and De Clerck O (2018). Bio_ORACLE v2. 0: Extending marine data layers for bioclimatic modelling. Global Ecology and Biogeography, 27(3), 277-284 , see also https://www.ecmwf.int/en/research/climate-reanalysis/ocean-reanalysis
Layer name: ice_cover_min Description: Ice concentration fraction, minimum on [1957-2017] time period Value range: 0 - 0.8536261 Units: unitless Source: BioOracle accessed 24/04/2018, see Assis et al. (2018) URL: http://www.bio-oracle.org/ Citation: Assis J, Tyberghein L, Bosch S, Verbruggen H, Serrao EA and De Clerck O (2018). Bio_ORACLE v2. 0: Extending marine data layers for bioclimatic modelling. Global Ecology and Biogeography, 27(3), 277-284 , see also https://www.ecmwf.int/en/research/climate-reanalysis/ocean-reanalysis
Layer name: ice_cover_range Description: Ice concentration fraction, difference maximum-minimum on [1957-2017] time period Value range: 0 - 1 Units: unitless Source: BioOracle accessed 24/04/2018, see Assis et al. (2018) URL: http://www.bio-oracle.org/ Citation: Assis J, Tyberghein L, Bosch S, Verbruggen H, Serrao EA and De Clerck O (2018). Bio_ORACLE v2. 0: Extending marine data layers for bioclimatic modelling. Global Ecology and Biogeography, 27(3), 277-284 , see also https://www.ecmwf.int/en/research/climate-reanalysis/ocean-reanalysis
Layer name: ice_thickness_max Description: Ice thickness, maximum on [1957-2017] time period Value range: 0 - 3.471811 Units: m Source: BioOracle accessed 24/04/2018, see Assis et al. (2018) URL: http://www.bio-oracle.org/ Citation: Assis J, Tyberghein L, Bosch S, Verbruggen H, Serrao EA and De Clerck O (2018). Bio_ORACLE v2. 0: Extending marine data layers for bioclimatic modelling. Global Ecology and Biogeography, 27(3), 277-284 , see also https://www.ecmwf.int/en/research/climate-reanalysis/ocean-reanalysis
Layer name: ice_thickness_mean Description: Ice thickness, mean on [1957-2017] time period Value range: 0 - 1.614133 Units: m Source: BioOracle accessed 24/04/2018, see Assis et al. (2018) URL: http://www.bio-oracle.org/ Citation: Assis J, Tyberghein L, Bosch S, Verbruggen H, Serrao EA and De Clerck O (2018). Bio_ORACLE v2. 0: Extending marine data layers for bioclimatic modelling. Global Ecology and Biogeography, 27(3), 277-284 , see also https://www.ecmwf.int/en/research/climate-reanalysis/ocean-reanalysis
Layer name: ice_thickness_min Description: Ice thickness, minimum on [1957-2017] time period Value range: 0 - 0.7602701 Units: m Source: BioOracle accessed 24/04/2018, see Assis et al. (2018) URL: http://www.bio-oracle.org/ Citation: Assis J, Tyberghein L, Bosch S, Verbruggen H, Serrao EA and De Clerck O (2018). Bio_ORACLE v2. 0: Extending marine data layers for bioclimatic modelling. Global Ecology and Biogeography, 27(3), 277-284 , see also https://www.ecmwf.int/en/research/climate-reanalysis/ocean-reanalysis
Layer name: ice_thickness_range Description: Ice thickness, difference maximum-minimum on [1957-2017] time period Value range: 0 - 3.471811 Units: m Source: BioOracle accessed 24/04/2018, see Assis et al. (2018) URL: http://www.bio-oracle.org/ Citation: Assis J, Tyberghein L, Bosch S, Verbruggen H, Serrao EA and De Clerck O (2018). Bio_ORACLE v2. 0: Extending marine data layers for bioclimatic modelling. Global Ecology and Biogeography, 27(3), 277-284 , see also https://www.ecmwf.int/en/research/climate-reanalysis/ocean-reanalysis
Layer name: chla_ampli_alltime_2005_2012 Description: Chlorophyll-a concentrations obtained from MODIS satellite data. Amplitude of pixel values (difference between maximal and minimal value encountered by each pixel during all months of the period [2005-2012]) Value range: 0 - 77.15122 Units: mg/m^3 Source: https://oceandata.sci.gsfc.nasa.gov/MODIS-Aqua/Mapped/Monthly/9km/chlor_a/ URL: https://modis.gsfc.nasa.gov/data/dataprod/chlor_a.php
Layer name: chla_max_alltime_2005_2012 Description: Chlorophyll-a concentrations obtained from MODIS satellite data. Maximal value encountered by each pixel during all months of the period [2005-2012] Value range: 0 - 77.28562 Units: mg/m^3 Source: https://oceandata.sci.gsfc.nasa.gov/MODIS-Aqua/Mapped/Monthly/9km/chlor_a/ URL: https://modis.gsfc.nasa.gov/data/dataprod/chlor_a.php
Layer name: chla_mean_alltime_2005_2012 Description: Chlorophyll-a concentrations obtained from MODIS satellite data. Mean value of each pixel during all months of the period [2005-2012] Value range: 0 - 30.42691 Units: mg/m^3 Source: https://oceandata.sci.gsfc.nasa.gov/MODIS-Aqua/Mapped/Monthly/9km/chlor_a/ URL: https://modis.gsfc.nasa.gov/data/dataprod/chlor_a.php
Layer name: chla_min_alltime_2005_2012 Description: Chlorophyll-a concentrations obtained from MODIS satellite data. Minimal value encountered by each pixel during all months of the period [2005-2012] Value range: 0 - 29.02929 Units: mg/m^3 Source: https://oceandata.sci.gsfc.nasa.gov/MODIS-Aqua/Mapped/Monthly/9km/chlor_a/ URL: https://modis.gsfc.nasa.gov/data/dataprod/chlor_a.php
Layer name: chla_sd_alltime_2005_2012 Description: Chlorophyll-a concentrations obtained from MODIS satellite data. Standard deviation value of each pixel during all months of the period [2005-2012] Value range: 0 - 27.9877 Units: mg/m^3 Source: https://oceandata.sci.gsfc.nasa.gov/MODIS-Aqua/Mapped/Monthly/9km/chlor_a/ URL: https://modis.gsfc.nasa.gov/data/dataprod/chlor_a.php
Layer name: POC_2005_2012_ampli Description: Particulate organic carbon, model Lutz et al. (2007). Amplitude value (difference maximal and minimal value, see previous layers) all seasonal layers [2005-2012] Value range: 0 - 1.31761 Units: g/m^2/d Source: This study. Following Lutz et al. (2007) URL: https://data.aad.gov.au/metadata/records/Particulate_carbon_export_flux_layers Citation: Lutz MJ, Caldeira K, Dunbar RB and Behrenfeld MJ (2007). Seasonal rhythms of net primary production and particulate organic carbon flux to depth describe the efficiency of biological pump in the global ocean. Journal of Geophysical Research: Oceans, 112(C10).
Layer name: POC_2005_2012_max Description: Particulate organic carbon, model Lutz et al. (2007). Maximal value encountered on each pixel among all seasonal layers [2005-2012] Value range: 0.00332562 - 1.376601 Units: g/m^2/d Source: This study. Following Lutz et al. (2007) URL: https://data.aad.gov.au/metadata/records/Particulate_carbon_export_flux_layers Citation: Lutz MJ, Caldeira K, Dunbar RB and Behrenfeld MJ (2007). Seasonal rhythms of net primary production and particulate organic carbon flux to depth describe the efficiency of biological pump in the global ocean. Journal of Geophysical Research: Oceans, 112(C10).
Layer name: POC_2005_2012_mean Description: Particulate organic carbon, model Lutz et al. (2007). Mean all seasonal layers [2005-2012] Value range: 0.003184335 - 0.5031364 Units: g/m^2/d Source: This study. Following Lutz et al. (2007) URL: https://data.aad.gov.au/metadata/records/Particulate_carbon_export_flux_layers Citation: Lutz MJ, Caldeira K, Dunbar RB and Behrenfeld MJ (2007). Seasonal rhythms of net primary production and particulate organic carbon flux to depth describe the efficiency of biological pump in the global ocean. Journal of Geophysical Research: Oceans, 112(C10).
Layer name: POC_2005_2012_min Description: Particulate organic carbon, model Lutz et al. (2007). Minimal value encountered on each pixel among all seasonal layers [2005-2012] Value range: 0.003116508 - 0.1313119 Units: g/m^2/d Source: This study. Following Lutz et al. (2007) URL: https://data.aad.gov.au/metadata/records/Particulate_carbon_export_flux_layers Citation: Lutz MJ, Caldeira K, Dunbar RB and Behrenfeld MJ (2007). Seasonal rhythms of net primary production and particulate organic carbon flux to depth describe the efficiency of biological pump in the global ocean. Journal of Geophysical Research: Oceans, 112(C10).
Layer name: POC_2005_2012_sd Description: Particulate organic carbon, model Lutz et al. (2007). Standard deviation all seasonal layers [2005-2012] Value range: 3.85E-08 - 0.4417001 Units: g/m^2/d Source: This study. Following Lutz et al. (2007) URL: https://data.aad.gov.au/metadata/records/Particulate_carbon_export_flux_layers Citation: Lutz MJ, Caldeira K, Dunbar RB and Behrenfeld MJ (2007). Seasonal rhythms of net primary production and particulate organic carbon flux to depth describe the efficiency of biological pump in the global ocean. Journal of Geophysical Research: Oceans, 112(C10).
Layer name: seafloor_oxy_1955_2012_ampli Description: Amplitude (difference maximum-minimum) value encountered for each pixel on all month layers of seafloor oxygen concentration over [1955-2012], modified from WOCE Value range: 0.001755714 - 5.285187 Units: mL/L Source: Derived from World Ocean Circulation Experiment 2013 URL: https://www.nodc.noaa.gov/OC5/woa13/woa13data.html
Layer name: seafloor_oxy_1955_2012_max Description: Maximum value encountered for each pixel on all month layers of oxygen concentration over [1955-2012], modified from WOCE Value range: 3.059685 - 11.52433 Units: mL/L Source: Derived from World Ocean Circulation Experiment 2013 URL: https://www.nodc.noaa.gov/OC5/woa13/woa13data.html
Layer name: seafloor_oxy_1955_2012_mean Description: Mean seafloor oxygen concentration over [1955-2012] (average of all monthly layers), modified from WOCE Value range: 2.836582 - 8.858084 Units: mL/L Source: Derived from World Ocean Circulation Experiment 2013 URL: https://www.nodc.noaa.gov/OC5/woa13/woa13data.html
Layer name: seafloor_oxy_1955_2012_min Description: Minimum value encountered for each pixel on all month layers of seafloor oxygen concentration over [1955-2012], modified from WOCE Value range: 0.4315577 - 8.350794 Units: mL/L Source: Derived from World Ocean Circulation Experiment 2013 URL: https://www.nodc.noaa.gov/OC5/woa13/woa13data.html
Layer name: seafloor_oxy_1955_2012_sd Description: Standard deviation seafloor oxygen concentration over [1955-2012] (of all monthly layers), modified from WOCE Value range: 0.000427063 - 1.588707 Units: mL/L Source: Derived from World Ocean Circulation Experiment 2013 URL: https://www.nodc.noaa.gov/OC5/woa13/woa13data.html
Layer name: seafloor_sali_2005_2012_ampli Description: Amplitude (difference maximum-minimum) value encountered for each pixel on all month layers of seafloor salinity over [2005-2012], modified from WOCE Value range: 0.000801086 - 4.249901 Units: PSU Source: Derived from World Ocean Circulation Experiment 2013 URL: https://www.nodc.noaa.gov/OC5/woa13/woa13data.html
Layer name: seafloor_sali_2005_2012_max Description: Maximum value encountered for each pixel on all month layers of seafloor salinity over [2005-2012], modified from WOCE Value range: 32.90105 - 35.3997 Units: PSU Source: Derived from World Ocean Circulation Experiment 2013 URL: https://www.nodc.noaa.gov/OC5/woa13/woa13data.html
Layer name: seafloor_sali_2005_2012_mean Description: Mean seafloor salinity over [2005-2012] (average of all monthly layers), modified from WOCE Value range: 32.51107 - 35.03207 Units: PSU Source: Derived from World Ocean Circulation Experiment 2013 URL: https://www.nodc.noaa.gov/OC5/woa13/woa13data.html
-
Layer name: seafloor_sali_2005_2012_min Description: Minimum value encountered for each pixel on all month layers of seafloor salinity over [2005-2012], modified from WOCE Value range: 29.8904
- 34.97735 Units: PSU Source: Derived from World Ocean Circulation Experiment 2013 URL: https://www.nodc.noaa.gov/OC5/woa13/woa13data.html
Layer name: seafloor_sali_2005_2012_sd Description: Standard deviation seafloor salinity over [2005-2012] (of all monthly layers), modified from WOCE Value range: 0.000251834 - 1.36245 Units: PSU Source: Derived from World Ocean Circulation Experiment 2013 URL: https://www.nodc.noaa.gov/OC5/woa13/woa13data.html
Layer name: seafloor_temp_2005_2012_ampli Description: Amplitude (difference maximum-minimum) value encountered for each pixel on all month layers of seafloor temperature over [2005-2012], modified from WOCE Value range: 0.0086 - 8.625669 Units: degrees C Source: Derived from World Ocean Circulation Experiment 2013 URL: https://www.nodc.noaa.gov/OC5/woa13/woa13data.html
Layer name: seafloor_temp_2005_2012_max Description: Maximum value encountered for each pixel on all month layers of seafloor temperature over [2005-2012], modified from WOCE Value range: -2.021455 - 15.93171 Units: degrees C Source: Derived from World Ocean Circulation Experiment 2013 URL: https://www.nodc.noaa.gov/OC5/woa13/woa13data.html
Layer name: seafloor_temp_2005_2012_mean Description: Mean seafloor temperature over [2005-2012] (average of all monthly layers), modified from WOCE Value range: -2.085796 - 13.23161 Units: degrees C Source: Derived from World Ocean Circulation Experiment 2013 URL: https://www.nodc.noaa.gov/OC5/woa13/woa13data.html
-
Layer name: seafloor_temp_2005_2012_min Description: Minimum value encountered for each pixel on all month layers of seafloor temperature over [2005-2012], modified from WOCE Value range: -2.1
- 11.6431 Units: degrees C Source: Derived from World Ocean Circulation Experiment 2013 URL: https://www.nodc.noaa.gov/OC5/woa13/woa13data.html
Layer name: seafloor_temp_2005_2012_sd Description: Standard deviation seafloor temperature over [2005-2012] (of all monthly layers), modified from WOCE Value range: 0.002843571 - 2.877084 Units: degrees C Source: Derived from World Ocean Circulation Experiment 2013 URL: https://www.nodc.noaa.gov/OC5/woa13/woa13data.html
Layer name: extreme_event_max_chl_2005_2012_ampli Description: Amplitude (difference maximum-minimum) number of the number of extreme events calculated between 2005 and 2012 Value range: integer values 0 - 3 Units: unitless Source: derived from chlorophyll-a concentration layers
Layer name: extreme_event_max_chl_2005_2012_max Description: Maximum number of extreme events calculated between 2005 and 2012 Value range: integer values 0 - 5 Units: unitless Source: derived from chlorophyll-a concentration layers
Layer name: extreme_event_max_chl_2005_2012_mean Description: Mean of the number of extreme events calculated between 2005 and 2012 Value range: 0 - 3.875 Units: unitless Source: derived from chlorophyll-a concentration layers
Layer name: extreme_event_max_chl_2005_2012_min Description: Minimum number of extreme events calculated between 2005 and 2012 Value range: integer values 0 - 5 Units: unitless Source: derived from chlorophyll-a concentration layers
Layer name: extreme_event_min_chl_2005_2012_ampli Description: Amplitude (difference maximum-minimum) number of the number of extreme events calculated between 2005 and 2012 Value range: integer values 0 - 9 Units: unitless Source: derived from chlorophyll-a concentration layers
Layer name: extreme_event_min_chl_2005_2012_max Description: Maximum number of extreme events calculated between 2005 and 2012 Value range: integer values 0 - 11 Units: unitless Source: derived from chlorophyll-a concentration layers
Layer name: extreme_event_min_chl_2005_2012_mean Description: Mean of the number of extreme events calculated between 2005 and 2012 Value range: 0 - 11 Units: unitless Source: derived from chlorophyll-a concentration layers
Layer name: extreme_event_min_chl_2005_2012_min Description: Minimum number of extreme events calculated between 2005 and 2012 Value range: integer values 0 - 11 Units: unitless Source: derived from chlorophyll-a concentration layers
Layer name: extreme_event_min_oxy_1955_2012_nb Description: Number of extreme events (minimal seafloor oxygen concentration records) that happened between January and December of the year Value range: integer values 0 - 12 Units: per year Source: derived from seafloor oxygen concentration layers
Layer name: extreme_event_max_sali_2005_2012_nb Description: Number of extreme events (maximal seafloor salinity records) that happened between January and December of the year Value range: integer values 0 - 12 Units: per year Source: derived from seafloor salinity layers
Layer name: extreme_event_min_sali_2005_2012_nb Description: Number of extreme events (minimal seafloor salinity records) that happened between January and December of the year Value range: integer values 0 - 12 Units: per year Source: derived from seafloor salinity layers
Layer name: extreme_event_max_temp_2005_2012_nb Description: Number of extreme events (maximal seafloor temperature records) that happened between January and December of the year Value range: integer values 0 - 12 Units: per year Source: derived from seafloor temperature layers
Layer name: extreme_event_min_temp_2005_2012_nb Description: Number of extreme events (minimal seafloor temperature records) that happened between January and December of the year Value range: integer values 0 - 12 Units: per year Source: derived from seafloor temperature layers
Approximate size: 0.3 GB
Documentation link: https://doi.org/10.26179/5b8f30e30d4f3
Data group: Ocean colour
Oceandata MODIS Aqua Level-3 binned daily RRS
Daily remote-sensing reflectance from MODIS Aqua. RRS is used to produce standard ocean colour products such as chlorophyll concentration
Authentication note: Requires Earthdata login, see https://urs.earthdata.nasa.gov/. Note that you will also need to authorize the application ‘OB.DAAC Data Access’ (see ‘My Applications’ at https://urs.earthdata.nasa.gov/profile)
Approximate size: 800 GB
Documentation link: https://oceancolor.gsfc.nasa.gov/
Oceandata MODIS Aqua Level-3 mapped daily 4km chl-a
Daily remote-sensing chlorophyll-a from the MODIS Aqua satellite at 4km spatial resolution
Authentication note: Requires Earthdata login, see https://urs.earthdata.nasa.gov/. Note that you will also need to authorize the application ‘OB.DAAC Data Access’ (see ‘My Applications’ at https://urs.earthdata.nasa.gov/profile)
Approximate size: 40 GB
Documentation link: https://oceancolor.gsfc.nasa.gov/
Oceandata MODIS Aqua Level-3 mapped monthly 9km chl-a
Monthly remote-sensing chlorophyll-a from the MODIS Aqua satellite at 9km spatial resolution
Authentication note: Requires Earthdata login, see https://urs.earthdata.nasa.gov/. Note that you will also need to authorize the application ‘OB.DAAC Data Access’ (see ‘My Applications’ at https://urs.earthdata.nasa.gov/profile)
Approximate size: 8 GB
Documentation link: https://oceancolor.gsfc.nasa.gov/
Oceandata SeaWiFS Level-3 binned daily RRS
Daily remote-sensing reflectance from SeaWiFS. RRS is used to produce standard ocean colour products such as chlorophyll concentration
Authentication note: Requires Earthdata login, see https://urs.earthdata.nasa.gov/. Note that you will also need to authorize the application ‘OB.DAAC Data Access’ (see ‘My Applications’ at https://urs.earthdata.nasa.gov/profile)
Approximate size: 130 GB
Documentation link: https://oceancolor.gsfc.nasa.gov/
Oceandata SeaWiFS Level-3 mapped monthly 9km chl-a
Monthly remote-sensing chlorophyll-a from the SeaWiFS satellite at 9km spatial resolution
Authentication note: Requires Earthdata login, see https://urs.earthdata.nasa.gov/. Note that you will also need to authorize the application ‘OB.DAAC Data Access’ (see ‘My Applications’ at https://urs.earthdata.nasa.gov/profile)
Approximate size: 7.2 GB
Documentation link: https://oceancolor.gsfc.nasa.gov/
Oceandata VIIRS Level-3 binned daily RRS
Daily remote-sensing reflectance from VIIRS. RRS is used to produce standard ocean colour products such as chlorophyll concentration
Authentication note: Requires Earthdata login, see https://urs.earthdata.nasa.gov/. Note that you will also need to authorize the application ‘OB.DAAC Data Access’ (see ‘My Applications’ at https://urs.earthdata.nasa.gov/profile)
Approximate size: 180 GB
Documentation link: https://oceancolor.gsfc.nasa.gov/
Oceandata VIIRS Level-3 mapped 32-day 9km chl-a
Rolling 32-day composite remote-sensing chlorophyll-a from the VIIRS satellite at 9km spatial resolution
Authentication note: Requires Earthdata login, see https://urs.earthdata.nasa.gov/. Note that you will also need to authorize the application ‘OB.DAAC Data Access’ (see ‘My Applications’ at https://urs.earthdata.nasa.gov/profile)
Approximate size: 4 GB
Documentation link: https://oceancolor.gsfc.nasa.gov/
Oceandata VIIRS Level-3 mapped daily 4km chl-a
Daily remote-sensing chlorophyll-a from the VIIRS satellite at 4km spatial resolution
Authentication note: Requires Earthdata login, see https://urs.earthdata.nasa.gov/. Note that you will also need to authorize the application ‘OB.DAAC Data Access’ (see ‘My Applications’ at https://urs.earthdata.nasa.gov/profile)
Approximate size: 50 GB
Documentation link: https://oceancolor.gsfc.nasa.gov/
Oceandata VIIRS Level-3 mapped monthly 9km chl-a
Monthly remote-sensing chlorophyll-a from the VIIRS satellite at 9km spatial resolution
Authentication note: Requires Earthdata login, see https://urs.earthdata.nasa.gov/. Note that you will also need to authorize the application ‘OB.DAAC Data Access’ (see ‘My Applications’ at https://urs.earthdata.nasa.gov/profile)
Approximate size: 1 GB
Documentation link: https://oceancolor.gsfc.nasa.gov/
Oceandata VIIRS Level-3 mapped seasonal 9km chl-a
Seasonal remote-sensing chlorophyll-a from the VIIRS satellite at 9km spatial resolution
Authentication note: Requires Earthdata login, see https://urs.earthdata.nasa.gov/. Note that you will also need to authorize the application ‘OB.DAAC Data Access’ (see ‘My Applications’ at https://urs.earthdata.nasa.gov/profile)
Approximate size: 0.5 GB
Documentation link: https://oceancolor.gsfc.nasa.gov/
Southern Ocean summer chlorophyll-a climatology (Johnson)
This dataset is a climatological summer chlorophyll-a layer for the Southern Ocean south of 40S, following the OC3M algorithm of Johnson et al. (2013). The climatology was calculated from level-3 binned MODISA RRS products spanning the 2002/03 to 2015/16 austral summer seasons (summer taken as day 355 to day 80).
Approximate size: 0.1 GB
Documentation link: https://doi.org/10.4225/15/5906b48f70bf9
Data group: Oceanographic
Argo ocean basin data (USGODAE)
Argo float data from the Global Data Access Centre in Monterey, USA (US Global Ocean Data Assimilation Experiment). These are multi-profile netcdf files divided by ocean basin.
Approximate size: not specified
Documentation link: http://www.argodatamgt.org/Documentation
Argo profile data
Argo profile data from https://usgodae.org/ftp/outgoing/argo/.
Approximate size: not specified
Documentation link: http://www.argodatamgt.org/Documentation
Argo profile data (USGODAE)
Argo profile data from the Global Data Access Centre in Monterey, USA (US Global Ocean Data Assimilation Experiment).
Approximate size: not specified
Documentation link: http://www.argodatamgt.org/Documentation
CSIRO Atlas of Regional Seas 2009
CARS is a digital climatology, or atlas of seasonal ocean water properties.
Approximate size: 2.8 GB
Documentation link: http://www.marine.csiro.au/~dunn/cars2009/
Effects of Sound on the Marine Environment
ESME uses publically available environmental data sources that provide detailed information about the ocean, in the form of four primary databases supplied by the Oceanographic and Atmospheric Master Library (OAML). (1) Bottom Sediment Type (BST) v 2.0 : This database provides information on the type of sediment on the ocean bottom, which affects its acoustic reflectivity. Available data resolutions: 2 min, 0.1 min. (2) Digital Bathymetry Database (DBDB) v 5.4 : This database provides information on the depth of the water column. Available data resolutions: 2 min, 1 min, .5 min, .1 min, 0.05 min. (3) Generalized Digital Environment Model (GDEM) v 3.0 : This database provides water temperature and water salinity data for a selected month or months of time, which is used to calculate the changes in the speed of sound in water. Available data resolution: 15 min. (4) Surface Marine Gridded Climatology (SMGC) v 2.0 : This database provides wind speed data for a selected month or months. Wind speed, and consequently surface roughness and wave height, affect the surface’s acoustic reflectivity. Available data resolution: 60 min.
Approximate size: 5 GB
Documentation link: https://esme.bu.edu/index.shtml
Roemmich-Gilson Argo Climatology
The Argo Program has achieved 15 years of global coverage, growing from a very sparse global array of 1000 profiling floats in 2004 to more than 3000 instruments from late 2007 to the present. A basic description of the modern upper ocean based entirely on Argo data is available here, to provide a baseline for comparison with past datasets and with ongoing Argo data, to test the adequacy of Argo sampling of large-scale variability, and to examine the consistency of the Argo dataset with related ocean observations from other programs. This new version of the Roemmich-Gilson Argo Climatology extends the analysis of Argo-only derived temperature and salinity fields through 2018. Several marginal seas and the Artic Ocean have been added. The analysis method is similar to what was descibed in the Progress In Oceanography Roemmich and Gilson paper (2009). The only modification has been to scale the zonal equatorial correlation of the optimal estimation step, by 8 times, versus 4 times as in the 2009 paper. The additional Argo data utilized in the analysis results in a longer monthly record as well as better estimates of the mean and variability fields. Monthly updates are available in between major biennial re-analyses.
Approximate size: 3 GB
Documentation link: https://sio-argo.ucsd.edu/RG_Climatology.html
World Ocean Atlas 2009
World Ocean Atlas 2009 (WOA09) is a set of objectively analyzed (1 degree grid) climatological fields of in situ temperature, salinity, dissolved oxygen, Apparent Oxygen Utilization (AOU), percent oxygen saturation, phosphate, silicate, and nitrate at standard depth levels for annual, seasonal, and monthly compositing periods for the World Ocean. It also includes associated statistical fields of observed oceanographic profile data interpolated to standard depth levels on both 1 degree and 5 degree grids
Approximate size: 6 GB
Documentation link: http://www.nodc.noaa.gov/OC5/WOA09/pr_woa09.html
World Ocean Atlas 2013 V2
World Ocean Atlas 2013 version 2 (WOA13 V2) is a set of objectively analyzed (1 degree grid) climatological fields of in situ temperature, salinity, dissolved oxygen, Apparent Oxygen Utilization (AOU), percent oxygen saturation, phosphate, silicate, and nitrate at standard depth levels for annual, seasonal, and monthly compositing periods for the World Ocean. It also includes associated statistical fields of observed oceanographic profile data interpolated to standard depth levels on 5 degree, 1 degree, and 0.25 degree grids
Approximate size: 57 GB
Documentation link: https://www.nodc.noaa.gov/OC5/woa13/
World Ocean Atlas 2018
The World Ocean Atlas (WOA) is a collection of objectively analyzed, quality controlled temperature, salinity, oxygen, phosphate, silicate, and nitrate means based on profile data from the World Ocean Database (WOD). It can be used to create boundary and/or initial conditions for a variety of ocean models, verify numerical simulations of the ocean, and corroborate satellite data.
Approximate size: not specified
Documentation link: https://www.ncei.noaa.gov/products/world-ocean-atlas
Data group: Reanalysis
CCMP Wind Product V2
The Cross-Calibrated Multi-Platform (CCMP) gridded surface vector winds are produced using satellite, moored buoy, and model wind data, and are a Level-3 ocean vector wind analysis product. The V2 CCMP processing combines Version-7 RSS radiometer wind speeds, QuikSCAT and ASCAT scatterometer wind vectors, moored buoy wind data, and ERA-Interim model wind fields using a Variational Analysis Method (VAM) to produce four maps daily of 0.25 degree gridded vector winds
Approximate size: 120 GB
Documentation link: https://www.remss.com/measurements/ccmp/
NCEP-DOE Reanalysis 1 monthly averages
The NCEP/NCAR Reanalysis 1 project is using a state-of-the-art analysis/forecast system to perform data assimilation using past data from 1948 to the present. Monthly averages are calculated from the 6-hourly model output.
Approximate size: 2 GB
Documentation link: https://www.esrl.noaa.gov/psd/data/gridded/data.ncep.reanalysis.html
NCEP-DOE Reanalysis 2 monthly averages
NCEP-DOE Reanalysis 2 is an improved version of the NCEP Reanalysis I model that fixed errors and updated paramterizations of of physical processes. Monthly averages are calculated from the 6-hourly model output.
Approximate size: 2 GB
Documentation link: http://www.esrl.noaa.gov/psd/data/gridded/data.ncep.reanalysis2.html
Data group: Sea ice
Artist AMSR-E sea ice concentration
Passive microwave estimates of daily sea ice concentration at 6.25km spatial resolution, from 19-Jun-2002 to 2-Oct-2011. Advanced Microwave Scanning Radiometer aboard EOS (AMSR-E) data have been used to produce a finer resolved sea-ice concentration data set gridded onto a polar-stereographic grid true at 70 degrees with 6.25 km grid resolution. The sea-ice concentration data available here have been computed by applying the ARTIST Sea Ice (ASI) algorithm to brightness temperatures measured with the 89 GHz AMSR-E channels. These channels have a considereably finer spatial resolution than the commonly used lower frequency channels.
Approximate size: 25 GB
Documentation link: https://www.cen.uni-hamburg.de/en/icdc/data/cryosphere/seaiceconcentration-asi-amsre.html
Artist AMSR2 near-real-time 3.125km sea ice concentration
Near-real-time passive microwave estimates of daily sea ice concentration at 3.125km spatial resolution (full Antarctic coverage).
Approximate size: 100 GB
Documentation link: https://seaice.uni-bremen.de/sea-ice-concentration/
Artist AMSR2 near-real-time sea ice concentration
Near-real-time passive microwave estimates of daily sea ice concentration at 6.25km spatial resolution, from 24-July-2012 to present.
Approximate size: 11 GB
Documentation link: https://seaice.uni-bremen.de/sea-ice-concentration/
Artist AMSR2 supporting files
Grids and landmasks for Artist AMSR2 passive microwave sea ice data.
Approximate size: 0.02 GB
Documentation link: https://seaice.uni-bremen.de/sea-ice-concentration/
CERSAT SSM/I sea ice concentration
Passive microwave sea ice concentration data at 12.5km resolution, 3-Dec-1991 to present
Approximate size: 2.5 GB
Documentation link: http://cersat.ifremer.fr/data/tools-and-services/quicklooks/sea-ice/ssm-i-sea-ice-concentration-maps
CERSAT SSM/I sea ice concentration supporting files
Grids for the CERSAT SSM/I sea ice concentration data.
Approximate size: 0.01 GB
Documentation link: http://cersat.ifremer.fr/data/tools-and-services/quicklooks/sea-ice/ssm-i-sea-ice-concentration-maps
Circum-Antarctic landfast sea ice extent, 2000-2018 - version 2.2
This dataset (provided as a series of CF-compatible netcdf file) consists of 432 consecutive maps of Antarctic landfast sea ice, derived from NASA MODIS imagery. There are 24 maps per year, spanning the 18 year period from March 2000 to Feb 2018. The data are provided in a polar stereographic projection with a latitude of true scale at 70 S (i.e., to maintain compatibility with the NSIDC polar stereographic projection).
Approximate size: 7.7 GB
Documentation link: https://doi.org/10.26179/5d267d1ceb60c
MODIS Composite Based Maps of East Antarctic Fast Ice Coverage
Maps of East Antarctic landfast sea-ice extent, generated from approx. 250,000 1 km visible/thermal infrared cloud-free MODIS composite imagery (augmented with AMSR-E 6.25-km sea-ice concentration composite imagery when required).
Because of imperfections in the MODIS composite images (typically caused by inaccurate cloud masking, persistent cloud in a given region, and/or a highly dynamic fast-ice edge), automation of the fast-ice extent retrieval process was not possible. Each image was thus classified manually. A study of errors/biases of this process revealed that most images were able to be classified with a 2-sigma accuracy of +/- ~3%. More details are provided in Fraser et al., (2010).
*Version 1.2 with extra QC around the Mawson coast and Lutzow-Holm Bay
The directory named “pngs” contains browsable maps of fast-ice extent, in the form of Portable Network Graphics (PNG) images. Each of the 159 consecutive images (20-day intervals from Day Of Year (DOY) 61-80, 2000 to DOY 341-366, 2008) contains a map of fast-ice extent along the East Antarctic coast, generated from MODIS and AMSR-E imagery. The colour scale is as follows:
Dark blue: Fast ice, as classified from a single 20-day MODIS composite image Red: Fast ice, as classified using the previous or next 20-day MODIS composite images Yellow: Fast ice, as classified using a single 20-day AMSR-E composite image White: Antarctic continent (including ice shelves), as defined using the Mosaic of Antarctica product. Light blue: Southern ocean/pack ice/icebergs
These maps are also provided as unformatted binary fast ice images, in the directory named “imgs”. These .img files are all flat binary images of dimension 4300 * 425 pixels. The data type is 8-bit byte. Within the .img files, the value for each pixel indicates its cover: 0: Southern Ocean, pack ice or icebergs, corresponding to light blue in the PNG files. 1: Antarctic continent (including ice shelves), as defined using the Mosaic of Antarctica product, corresponding to white in the PNG files. 2: Fast ice, as classified from a single 20-day MODIS composite image, corresponding to dark blue in the PNG files 3: Fast ice, as classified using a single 20-day AMSR-E composite image, corresponding to yellow in the PNG files 4: Fast ice, as classified using the previous or next 20-day MODIS composite images, corresponding to red in the PNG files
To assist in georeferencing these data, files containing information on the latitude and longitude of each pixel are provided in the directory named “geo”. These files are summarised as follows:
lats.img: File containing the latitude of the centre of each pixel. File format is unformatted 32-bit floating point, 4300 * 425 pixels. lons.img: File containing the longitude of the centre of each pixel. File format is unformatted 32-bit floating point, 4300 * 425 pixels.
The .gpd Grid Point Descriptor file used to build the projection is also included. It contains parameters which you can use for matching your projection.
To refer to the time series, climatology, or maps of average persistence, please reference this paper: Fraser, A. D., R. A. Massom, K. J. Michael, B. K. Galton-Fenzi, and J. L. Lieser, East Antarctic landfast sea ice distribution and variability, 2000-08, Journal of Climate 25, 4, pp. 1137-1156, 2012
In addition, please cite the following reference when describing the process of generating these maps: Fraser, A. D., R. A. Massom, and K. J. Michael, Generation of high-resolution East Antarctic landfast sea-ice maps from cloud-free MODIS satellite composite imagery, Elsevier Remote Sensing of Environment, 114 (12), 2888-2896, doi:10.1016/j.rse.2010.07.006, 2010.
To reference the techniques for generating the MODIS composite images, please use the following reference: Fraser, A. D., R. A. Massom, and K. J. Michael, A method for compositing polar MODIS satellite images to remove cloud cover for landfast sea-ice detection, IEEE Transactions on Geoscience and Remote Sensing, 47 (9), pp. 3272-3282, doi:10.1109/TGRS.2009.2019726, 2009.
Please contact Alex Fraser (adfraser@utas.edu.au) for further information.
Approximate size: 0.3 GB
Documentation link: https://doi.org/10.4225/15/5667AC726B224
National Ice Center Antarctic daily sea ice charts
The USNIC Daily Ice Edge product depicts the daily sea ice pack in red (8-10/10ths or greater of sea ice), and the Marginal Ice Zone (MIZ) in yellow. The marginal ice zone is the transition between the open ocean (ice free) and pack ice. The MIZ is very dynamic and affects the air-ocean heat transport, as well as being a significant factor in navigational safety. The daily ice edge is analyzed by sea ice experts using multiple sources of near real time satellite data, derived satellite products, buoy data, weather, and analyst interpretation of current sea ice conditions. The product is a current depiction of the location of the ice edge vice a satellite derived ice edge product.
Approximate size: not specified
Documentation link: https://usicecenter.gov/Products/AntarcHome
Near-Real-Time DMSP SSMIS Daily Polar Gridded Sea Ice Concentrations, Version 2
Near-real-time passive microwave estimates of sea ice concentration at 25km, daily resolution. For older, quality-controlled data see the “NSIDC SMMR-SSM/I Nasateam sea ice concentration” source
Authentication note: Requires Earthdata login, see https://urs.earthdata.nasa.gov/. Note that you will also need to authorize the application ‘NSIDC_DATAPOOL_OPS’ (see ‘My Applications’ at https://urs.earthdata.nasa.gov/profile)
Approximate size: 0.2 GB
Documentation link: https://nsidc.org/data/nsidc-0081/versions/2
Nimbus Ice Edge Points from Nimbus Visible Imagery
This data set (NmIcEdg2) estimates the location of the North and South Pole sea ice edges at various times during the mid to late 1960s, based on recovered Nimbus 1 (1964), Nimbus 2 (1966), and Nimbus 3 (1969) visible imagery.
Authentication note: Requires Earthdata login, see https://urs.earthdata.nasa.gov/. Note that you will also need to authorize the application ‘NSIDC_DATAPOOL_OPS’ (see ‘My Applications’ at https://urs.earthdata.nasa.gov/profile)
Approximate size: 0.1 GB
Documentation link: http://nsidc.org/data/nmicedg2/
NSIDC passive microwave supporting files
Grids and other support files for NSIDC passive microwave sea ice data.
Approximate size: 0.1 GB
Documentation link: http://nsidc.org/data/nsidc-0051.html
NSIDC SMMR-SSM/I Nasateam sea ice concentration
Passive microwave estimates of sea ice concentration at 25km spatial resolution. Daily and monthly resolution, available from 1-Oct-1978 to present. Data undergo a quality checking process and are updated annually. More recent data if required are available via the “NSIDC SMMR-SSM/I Nasateam near-real-time sea ice concentration” source.
Authentication note: Requires Earthdata login, see https://urs.earthdata.nasa.gov/. Note that you will also need to authorize the application ‘NSIDC_DATAPOOL_OPS’ (see ‘My Applications’ at https://urs.earthdata.nasa.gov/profile)
Approximate size: 10 GB
Documentation link: http://nsidc.org/data/nsidc-0051.html
Polarview Sentinel-1 imagery
Sentinel-1 imagery from polarview.aq
Approximate size: not specified
Documentation link: https://www.polarview.aq/
Sea Ice Concentrations from Nimbus-7 SMMR and DMSP SSM/I-SSMIS Passive Microwave Data, Version 2
Passive microwave estimates of sea ice concentration at 25km spatial resolution. Daily and monthly resolution, available from 1-Oct-1978 to present. Data undergo a quality checking process and are updated annually. Near-real-time data if required are available via the “Near-Real-Time DMSP SSMIS Daily Polar Gridded Sea Ice Concentrations, Version 2” source.
Authentication note: Requires Earthdata login, see https://urs.earthdata.nasa.gov/. Note that you will also need to authorize the application ‘NSIDC_DATAPOOL_OPS’ (see ‘My Applications’ at https://urs.earthdata.nasa.gov/profile)
Approximate size: 5 GB
Documentation link: https://nsidc.org/data/nsidc-0051/versions/2
Sea ice lead climatologies
Long-term relative sea ice lead frequencies for the Arctic (November - April 2002/03 - 2018/19) and Antarctic (April - September 2003 - 2019). Ice surface temperature data (MYD/MOD29 col. 6) from the Moderate-Resolution Imaging Spectroradiometer are used to derive daily observations of sea ice leads in both polar regions. Sea ice leads are defined as significant local surface temperature anomalies and they are automatically identified during a two-stage process, including 1) the tile-based retrieval of potential sea ice leads and 2) the identification of cloud artefacts using fuzzy logic (see Reiser et al., 2020 for further details). Subsequently, all daily sea ice lead maps are combined to long-term averages showing the climatological distribution of leads in the Arctic and Antarctic. The dataset represents an update for the Arctic (Willmes & Heinemann, 2016) and is the first for the Antarctic. These maps reveal that multiple distinct features with increased lead frequencies are present that are related to bathymetric structures, e.g. the continental shelf break or ridges and troughs.
Approximate size: 0.25 GB
Documentation link: https://doi.pangaea.de/10.1594/PANGAEA.917588
Data group: Sea surface temperature
GHRSST Level 4 MUR Global Foundation SST v4.1
A Group for High Resolution Sea Surface Temperature (GHRSST) Level 4 sea surface temperature analysis produced as a retrospective dataset (four day latency) at the JPL Physical Oceanography DAAC using wavelets as basis functions in an optimal interpolation approach on a global 0.011 degree grid. The version 4 Multiscale Ultrahigh Resolution (MUR) L4 analysis is based upon nighttime GHRSST L2P skin and subskin SST observations from several instruments including the NASA Advanced Microwave Scanning Radiometer-EOS (AMSRE), the Moderate Resolution Imaging Spectroradiometer (MODIS) on the NASA Aqua and Terra platforms, the US Navy microwave WindSat radiometer and in situ SST observations from the NOAA iQuam project. The ice concentration data are from the archives at the EUMETSAT Ocean and Sea Ice Satellite Application Facility (OSI SAF) High Latitude Processing Center and are also used for an improved SST parameterization for the high-latitudes. This data set is funded by the NASA MEaSUREs program (http://earthdata.nasa.gov/our-community/community-data-system-programs/measures-projects), and created by a team led by Dr. Toshio Chin from JPL.
Authentication note: Requires Earthdata login, see https://urs.earthdata.nasa.gov/. Note that you will also need to authorize the PODAAC application (see ‘My Applications’ at https://urs.earthdata.nasa.gov/profile)
Approximate size: 2000 GB
Documentation link: https://podaac.jpl.nasa.gov/dataset/MUR-JPL-L4-GLOB-v4.1
NOAA Extended Reconstructed SST V3b
A global monthly SST analysis from 1854 to the present derived from ICOADS data with missing data filled in by statistical methods
Approximate size: 0.3 GB
Documentation link: http://www.esrl.noaa.gov/psd/data/gridded/data.noaa.ersst.html
NOAA Extended Reconstructed SST V5
A global monthly sea surface temperature dataset derived from the International Comprehensive Ocean-Atmosphere Dataset (ICOADS)
Approximate size: 0.3 GB
Documentation link: https://www.ncdc.noaa.gov/data-access/marineocean-data/extended-reconstructed-sea-surface-temperature-ersst-v5
NOAA OI 1/4 Degree Daily SST AVHRR
Sea surface temperature at 0.25 degree daily resolution, from 1-Sep-1981 to present
Approximate size: 140 GB
Documentation link: https://www.ncei.noaa.gov/metadata/geoportal/rest/metadata/item/gov.noaa.ncdc:C00844/html
NOAA OI 1/4 Degree Daily SST AVHRR v2
Sea surface temperature at 0.25 degree daily resolution, from 1-Sep-1981 to Apr-2020
Approximate size: 140 GB
Documentation link: https://www.ncei.noaa.gov/metadata/geoportal/rest/metadata/item/gov.noaa.ncdc:C00844/html
NOAA OI SST V2
Weekly and monthly mean and long-term monthly mean SST data, 1-degree resolution, 1981 to present. Ice concentration data are also included, which are the ice concentration values input to the SST analysis
Approximate size: 0.9 GB
Documentation link: http://www.esrl.noaa.gov/psd/data/gridded/data.noaa.oisst.v2.html
Oceandata MODIS Aqua Level-3 mapped monthly 9km SST
Monthly remote-sensing SST from the MODIS Aqua satellite at 9km spatial resolution
Approximate size: 7 GB
Documentation link: http://oceancolor.gsfc.nasa.gov/
Oceandata MODIS Terra Level-3 mapped monthly 9km SST
Monthly remote-sensing sea surface temperature from the MODIS Terra satellite at 9km spatial resolution
Approximate size: 7 GB
Documentation link: http://oceancolor.gsfc.nasa.gov/
Data group: Topography
AAS_4116_Coastal_Complexity
The Antarctic outer coastal margin (i.e., the coastline itself, or the terminus/front of ice shelves, whichever is adjacent to the ocean) is the key interface between the marine and terrestrial environments. Its physical configuration (including both length scale of variation and orientation/aspect) has direct bearing on several closely associated cryospheric, biological, oceanographical and ecological processes, yet no study has quantified the coastal complexity or orientation of Antarctica’s coastal margin. This first-of-a-kind characterisation of Antarctic coastal complexity aims to address this knowledge gap. We quantify and investigate the physical configuration and complexity of Antarctica’s circumpolar outer coastal margin using a novel, technique based on ~40,000 random points selected along a vector coastline derived from the MODIS Mosaic of Antarctica dataset. At each point, a complexity metric is calculated at length scales from 1 to 256 km, giving a multiscale estimate of the magnitude and direction of undulation or complexity at each point location along the entire coastline.
General description of the data
| A shapefile of ~40,000 random points selected along a vector coastline derived from the MODIS Mosaic of Antarctica dataset. At each point coastal complexity is calculated including magnitude and orientation at multiple scales and features such as bays and peninsulas identified. The structure of the dataset is as follows: |
| Fields Definitions |
STATION………………………Station number EASTING………………………Easting Polar Stereographic NORTHING……………………Northing Polar Stereographic X_COORD…………………….X geographic coordinate
Y_COORD…………………….Y geographic coordinate COAST_EDGE……………….Type of coast ‘Ice shelf/Ground’ FEAT_01KM – 256KM………Described feature ‘Bay/Peninsula’ AMT_01KM – 256KM……….Measure of complexity, Angled Measurement Technique 0-180 degrees MAG_01KM – 256KM………Measure of complexity - Magnitude on dimensionless scale 0-100
ANG_01KM – 256KM………Angle (absolute angle of station points from reference 0, 0)
*ANGR_01KM – 256KM….…Angle of ‘Magnitude’ (relative to coastline - directly offshore being 0/360°)
*Repeated for length scales 1, 2, 4, 8, 16, 32, 64, 128 and 256 kms at each point
Approximate size: 0.1 GB
Documentation link: https://doi.org/10.26179/5d1af0ba45c03
Bedmap2
Bedmap2 is a suite of gridded products describing surface elevation, ice-thickness and the sea floor and subglacial bed elevation of the Antarctic south of 60S.
Approximate size: 3.3 GB
Documentation link: https://www.bas.ac.uk/project/bedmap-2/
Cryosat-2 digital elevation model
A New Digital Elevation Model of Antarctica derived from 6 years of continuous CryoSat-2 measurements
Approximate size: 2 GB
Documentation link: https://doi.org/10.5194/tc-2017-223
EGM2008 Global 2.5 Minute Geoid Undulations
Each zip file contains an ESRI GRID raster data set of 2.5-minute geoid undulation values covering a 45 x 45 degree area. Each raster file has a 2.5-minute cell size and is a subset of the global 2.5 x 2.5-minute grid of pre-computed geoid undulation point values found on the EGM2008-WGS 84 Version web page. This ESRI GRID format represents a continuous surface of geoid undulation values where each 2.5-minute raster cell derives its value from the original pre-computed geoid undulation point value located at the SW corner of each cell.
Approximate size: not specified
Documentation link: https://earth-info.nga.mil/GandG/wgs84/gravitymod/egm2008/egm08_gis.html
ETOPO1 bathymetry
ETOPO1 is a 1 arc-minute global relief model of Earth’s surface that integrates land topography and ocean bathymetry.
Approximate size: 1.3 GB
Documentation link: http://www.ngdc.noaa.gov/mgg/global/global.html
ETOPO2 bathymetry
2-Minute Gridded Global Relief Data (ETOPO2v2c)
Approximate size: 0.3 GB
Documentation link: http://www.ngdc.noaa.gov/mgg/global/etopo2.html
GEBCO 2014 bathymetry
A global grid at 30 arc-second intervals. Originally published in 2014, last updated in April 2015. The data set is largely based on a database of ship-track soundings with interpolation between soundings guided by satellite-derived gravity data. Where they improve on this model, data sets generated from other methods are included. The grid is accompanied by a Source Identifier Grid (SID). This indicates if the corresponding cells in the GEBCO_2014 Grid are based on soundings, pre-generated grids or interpolation.
Approximate size: 1.2 GB
Documentation link: https://www.gebco.net/data_and_products/historical_data_sets/#gebco_2014
GEBCO 2014 bathymetry SID
A global grid at 30 arc-second intervals. Originally published in 2014, last updated in April 2015. The data set is largely based on a database of ship-track soundings with interpolation between soundings guided by satellite-derived gravity data. Where they improve on this model, data sets generated from other methods are included. The grid is accompanied by a Source Identifier Grid (SID). This indicates if the corresponding cells in the GEBCO_2014 Grid are based on soundings, pre-generated grids or interpolation.
Approximate size: 0.1 GB
Documentation link: https://www.gebco.net/data_and_products/historical_data_sets/#gebco_2014
GEBCO 2019 bathymetry
The GEBCO_2019 Grid is the latest global bathymetric product released by the General Bathymetric Chart of the Oceans (GEBCO). The GEBCO_2019 product provides global coverage, spanning 89d 59’ 52.5“N, 179d 59’ 52.5”W to 89d 59’ 52.5“S, 179d 59’ 52.5”E on a 15 arc-second grid. It consists of 86400 rows x 43200 columns, giving 3,732,480,000 data points. The data values are pixel-centre registered i.e. they refer to elevations at the centre of grid cells.
Approximate size: 13 GB
Documentation link: https://www.gebco.net/data_and_products/gridded_bathymetry_data/gebco_2019/gebco_2019_info.html
GEBCO 2021 bathymetry
The GEBCO_2021 Grid is a global terrain model for ocean and land, providing elevation data, in meters, on a 15 arc-second interval grid. It includes a number of additonal data sets compared to the GEBCO_2020 Grid. The grid is accompanied by a Type Identifier (TID) Grid, giving information on the types of source data that the GEBCO_2021 Grid is based on. The primary GEBCO_2021 grid contains land and ice surface elevation information - as provided for previous GEBCO grid releases. In addition, for the 2021 release, we have made available a version with under-ice topography/bathymetry information for Greenland and Antarctica.
Approximate size: 11.5 GB
Documentation link: https://www.gebco.net/data_and_products/gridded_bathymetry_data/gebco_2021/
GEBCO 2021 sub-ice bathymetry
The GEBCO_2021 Grid is a global terrain model for ocean and land, providing elevation data, in meters, on a 15 arc-second interval grid. It includes a number of additonal data sets compared to the GEBCO_2020 Grid. The grid is accompanied by a Type Identifier (TID) Grid, giving information on the types of source data that the GEBCO_2021 Grid is based on. The primary GEBCO_2021 grid contains land and ice surface elevation information - as provided for previous GEBCO grid releases. In addition, for the 2021 release, we have made available a version with under-ice topography/bathymetry information for Greenland and Antarctica.
Approximate size: 11.5 GB
Documentation link: https://www.gebco.net/data_and_products/gridded_bathymetry_data/gebco_2021/
GEBCO 2021 type identifier grid
The GEBCO_2021 Grid is a global terrain model for ocean and land, providing elevation data, in meters, on a 15 arc-second interval grid. It includes a number of additonal data sets compared to the GEBCO_2020 Grid. The grid is accompanied by a Type Identifier (TID) Grid, giving information on the types of source data that the GEBCO_2021 Grid is based on. The primary GEBCO_2021 grid contains land and ice surface elevation information - as provided for previous GEBCO grid releases. In addition, for the 2021 release, we have made available a version with under-ice topography/bathymetry information for Greenland and Antarctica.
Approximate size: 4.5 GB
Documentation link: https://www.gebco.net/data_and_products/gridded_bathymetry_data/gebco_2021/
George V bathymetry
This dataset comprises Digital Elevation Models (DEMs) of varying resolutions for the George V and Terre Adelie continental margin, derived by incorporating all available singlebeam and multibeam point depth data into ESRI ArcGIS grids. The purpose was to provide revised DEMs for Census of Antarctic Marine Life (CAML) researchers who required accurate, high-resolution depth models for correlating seabed biota data against the physical environment. The DEM processing method utilised all individual multibeam and singlebeam depth points converted to geographic xyz (long/lat/depth) ASCII files. In addition, an ArcGIS line shapefile of the East Antarctic coastline showing the grounding lines of coastal glaciers and floating ice shelves, was converted to a xyz ASCII file with 0 m as the depth value. Land elevation data utilised the Radarsat Antarctic Mapping Project (RAMP) 200 m DEM data converted to xyz ASCII data. All depth, land and coastline ASCII files were input to Fledermaus 3DEditor visualisation software for removal of noisy data. The cleaned point data were then binned into a gridded surface using Fledermaus DMagic software, resulting in a 0.001-arcdegree (~100 m) resolution DEM with holes where no input data exists. ArcGIS Topogrid software was used to interpolate across the holes to output a full-coverage DEM. ArcGIS was used to produce the additional 0.0025-arcdegree (~250 m) and 0.005-arcdegree (~500 m) resolution grids. Full processing details can be viewed in: Beaman, R.J., O’Brien, P.E., Post, A.L., De Santis, L., 2011. A new high-resolution bathymetry model for the Terre Adelie and George V continental margin, East Antarctica. Antarctic Science 23(1), 95-103. doi:10.1017/S095410201000074X
Approximate size: 0.2 GB
Documentation link: https://data.aad.gov.au/metadata/records/GVdem_2008
Geoscience Australia multibeam bathymetric grids of the Macquarie Ridge
This is a compilation of all the processed multibeam bathymetry data that are publicly available in Geoscience Australia’s data holding for the Macquarie Ridge.
Approximate size: 0.4 GB
Documentation link: https://doi.org/10.4225/25/53D9B12E0F96E
GSHHG coastline data
A Global Self-consistent, Hierarchical, High-resolution Geography Database
Approximate size: 0.6 GB
Documentation link: http://www.soest.hawaii.edu/pwessel/gshhg
IBCSO bathymetry
The International Bathymetric Chart of the Southern Ocean (IBCSO) Version 1.0 is a new digital bathymetric model (DBM) portraying the seafloor of the circum-Antarctic waters south of 60S. IBCSO is a regional mapping project of the General Bathymetric Chart of the Oceans (GEBCO). The IBCSO Version 1.0 DBM has been compiled from all available bathymetric data collectively gathered by more than 30 institutions from 15 countries. These data include multibeam and single-beam echo soundings, digitized depths from nautical charts, regional bathymetric gridded compilations, and predicted bathymetry. Specific gridding techniques were applied to compile the DBM from the bathymetric data of different origin, spatial distribution, resolution, and quality. The IBCSO Version 1.0 DBM has a resolution of 500 x 500 m, based on a polar stereographic projection, and is publicly available together with a digital chart for printing from the project website (www.ibcso.org) and at http://dx.doi.org/10.1594/PANGAEA.805736.
Approximate size: 4.3 GB
Documentation link: http://www.ibcso.org/
IBCSO chart for printing
The IBCSO Poster, 2013, is a polar stereographic view of the Southern Ocean displaying bathymetric contours south of 60S at a scale of 1:7,000,000. The poster size is 39.25 x 47.125 inches.
Approximate size: 0.2 GB
Documentation link: http://www.ibcso.org/
IBCSOv2 bathymetry
The International Bathymetric Chart of the Southern Ocean Version 2 (IBCSO v2) is a digital bathymetric model for the area south of 50S with special emphasis on the bathymetry of the Southern Ocean. IBCSO v2 has a resolution of 500 m x 500 m in a Polar Stereographic projection. The total data coverage of the seafloor is 23.79% with a multibeam-only data coverage of 22.32%. The remaining 1.47% include singlebeam and other data. IBCSO v2 is the most authoritative seafloor map of the area south of 50S.
Approximate size: 0.5 GB
Documentation link: http://www.ibcso.org/
Kerguelen Plateau bathymetric grid 2010
This data replaces the digital elevation model (DEM) for the Kerguelen Plateau region produced in 2005 (Sexton 2005). The revised grid has been gridded at a grid pixel resolution of 0.001-arc degree (about 100 m). The new grid utilised the latest data sourced from ship-based multibeam and singlebeam echosounder surveys, and satellite remotely-sensed data. Report Reference: Beaman, R.J. and O’Brien, P.E., 2011. Kerguelen Plateau bathymetric grid, November 2010. Geoscience Australia, Record, 2011/22, 18 pages.
Approximate size: 0.7 GB
Documentation link: http://pid.geoscience.gov.au/dataset/ga/71670
Natural Earth 10m physical vector data
Natural Earth is a public domain map dataset available at 1:10m, 1:50m, and 1:110 million scales.
Approximate size: 0.2 GB
Documentation link: http://www.naturalearthdata.com/downloads/10m-physical-vectors/
New Zealand Regional Bathymetry 2016
The NZ 250m gridded bathymetric data set and imagery, Mitchell et al. 2012, released 2016.
Approximate size: 1.3 GB
Documentation link: https://www.niwa.co.nz/our-science/oceans/bathymetry/further-information
Radarsat Antarctic digital elevation model V2
The high-resolution Radarsat Antarctic Mapping Project (RAMP) digital elevation model (DEM) combines topographic data from a variety of sources to provide consistent coverage of all of Antarctica. Version 2 improves upon the original version by incorporating new topographic data, error corrections, extended coverage, and other modifications.
Approximate size: 5.3 GB
Documentation link: http://nsidc.org/data/nsidc-0082
Reference Elevation Model of Antarctica mosaic tiles
The Reference Elevation Model of Antarctica (REMA) is a high resolution, time-stamped digital surface model of Antarctica at 8-meter spatial resolution. REMA is constructed from hundreds of thousands of individual stereoscopic Digital Elevation Models (DEM) extracted from pairs of submeter (0.32 to 0.5 m) resolution DigitalGlobe satellite imagery. Version 1 of REMA includes approximately 98% of the contiguous continental landmass extending to maximum of roughly 88 degrees S. Output DEM raster files are being made available as both ‘strip’ files as they are output directly from SETSM that preserve the original source material temporal resolution, as well as mosaic tiles that are compiled from multiple strips that have been co-registered, blended, and feathered to reduce edge-matching artifacts.
Approximate size: 1.2 GB
Documentation link: https://www.pgc.umn.edu/data/rema/
Revision of the Kerguelen Plateau bathymetric grid
The existing regional bathymetric grid of the Kerguelen Plateau, south-west Indian Ocean, was updated using new singlebeam echosounder data from commercial fishing and research voyages, and some new multibeam swath bathymetry data. Source bathymetry data varies from International Hydrographic Organisation (IHO) S44 Order 1a to 2. The source data were subjected to area-based editing to remove data spikes, then combined with the previous Sexton (2005) grid to produce a new grid with a resolution of 0.001-arcdegree. Satellite-derived datasets were used to provide island topography and to fill in areas of no data. The new grid improves the resolution of morphological features observed in earlier grids, including submarine volcanic hills on the top of the Kerguelen Plateau and a complex of submarine channels draining the southern flank of the bank on which Heard Island sits
Approximate size: 0.7 GB
Documentation link: http://pid.geoscience.gov.au/dataset/ga/71552
RTOPO-1 Antarctic ice shelf topography
Sub-ice shelf circulation and freezing/melting rates in ocean general circulation models depend critically on an accurate and consistent representation of cavity geometry. The goal of this work is to compile independent regional fields into a global data set. We use the S-2004 global 1-minute bathymetry as the backbone and add an improved version of the BEDMAP topography for an area that roughly coincides with the Antarctic continental shelf. Locations of the merging line have been carefully adjusted in order to get the best out of each data set. High-resolution gridded data for upper and lower ice surface topography and cavity geometry of the Amery, Fimbul, Filchner-Ronne, Larsen C and George VI Ice Shelves, and for Pine Island Glacier have been carefully merged into the ambient ice and ocean topographies. Multibeam survey data for bathymetry in the former Larsen B cavity and the southeastern Bellingshausen Sea have been obtained from the data centers of Alfred Wegener Institute (AWI), British Antarctic Survey (BAS) and Lamont-Doherty Earth Observatory (LDEO), gridded, and again carefully merged into the existing bathymetry map.
Approximate size: 4.1 GB
Documentation link: http://epic.awi.de/30738/
Shuttle Radar Topography Mission elevation data SRTMGL1 V3
Global 1-arc-second topographic data generated from NASA’s Shuttle Radar Topography Mission. Version 3.0 (aka SRTM Plus or Void Filled) removes all of the void areas by incorporating data from other sources such as the ASTER GDEM.
Authentication note: Requires Earthdata login, see https://urs.earthdata.nasa.gov/
Approximate size: 620 GB
Documentation link: https://lpdaac.usgs.gov/dataset_discovery/measures/measures_products_table/srtmgl1_v003
Smith and Sandwell bathymetry
Global seafloor topography from satellite altimetry and ship depth soundings
Approximate size: 1.4 GB
Documentation link: https://topex.ucsd.edu/marine_topo/