Show the arena
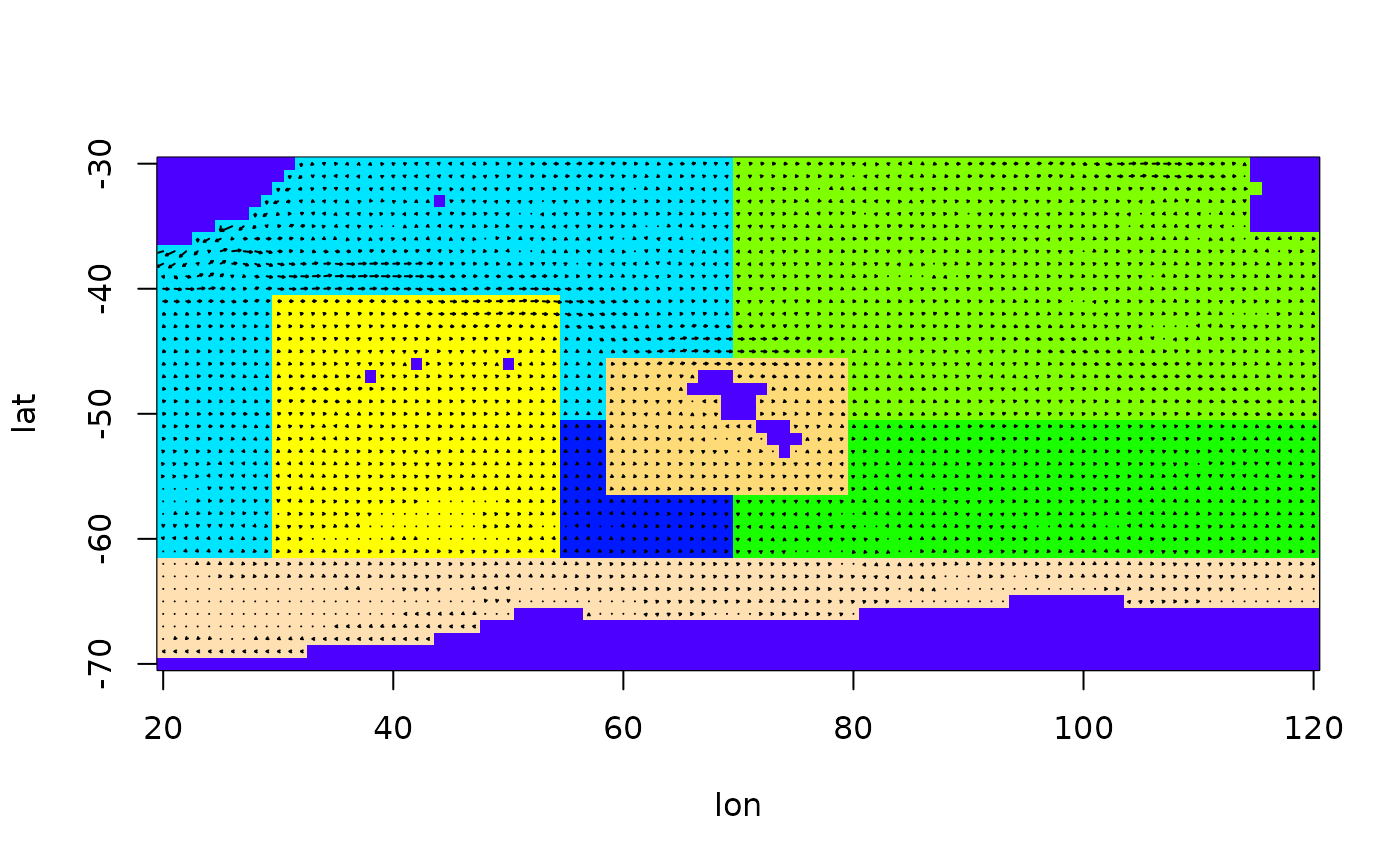
plot.arena.RdPlots a graphical representation of the flow field together with the polygon
structure. This is a method for the generic function plot and can
therefore be called as plot(arena_object).
# S3 method for arena
plot(x, arrow_scale = 1, grid = FALSE, ...)
Arguments
- x
An object of class
arena, see details.- arrow_scale
The length of the longest arrow is
arrow\_scaletimes the distance between two neighbouring grid points.- grid
If TRUE, a grid is drawn marking the boxes around the grid points.
- ...
Further arguments to the
plotfuntion.
Details
An arena object describes the arena in which the function is to be
used. It is a list containing elements lat, lon, U,
V and S (in that order), where lat and lon are
vectors storing the latitude and longitude values of the grid points used,
U and V are matrices with the corresponding flow velocities in
west-east and south-north direction, and S is a matrix in which each
grid points has an integer number, either giving the polygon it belongs to
(if > 0) or stating that this grid point lies on land (if == 0).
References
TODO: my report
See also
Examples
data(Udata)
data(Vdata)
data(Sdata)

arena = prepare.arena(Udata,Vdata,Sdata)
plot(arena)